1 - Deployment Types & Architecture
Chose the right deployment type for you.
First of all you’ll have to decide which RealLoad deployment type better suits your needs. These guidelines should assist you in making an informed decision.
Architecture
There a few components that make up the RealLoad solution. Most components are available under an SaaS model which doesn’t require any infrastructure commitment from your side.
If required by security or other constraints, some or all components can be deployed on your own infrastructure. Please reach out to us to discuss requirements if you’re planning to go down this road.
The key components that make up RealLoad’s solution are:
The Portal Server
- Exposes the main GUI to end users.
- All tasks to maintain Load Testing or Synthetic Monitoring scripts are performed here.
- Load Tests are can be triggered via the Portal.
- The Synthetic Monitoring dashboard is visible here and shows the current state of configured tests.
Measuring Agent
- Load Test and Synthetic Monitoring scripts are executed from Measuring Agents.
- For Synthetic Monitoring purposes, you can use shared or dedicated agents to execute your tests from.
- The Measuring Agent needs to be reachable from RealLoad’s portal server and needs to be able to reach the servers to be load tested or monitored.
- You can have multiple Measuring Agents, for example to execute Synthetic Monitoring tests from different locations.
There are 2 options for your to run AWS cloud based Measuring Agents:
- Using our Cloud Credits: The relevant Virtual Machines are spun up from our portal under our own AWS account and you pay a usage fee using Cloud Credits you’ve previously purchased from us.
- By starting pre-configured AWS AMIs under your own AWS account. You’ll be charged directly for AWS related costs.
Cluster Controller (Optional)
- If your Load Testing requirements exceed the load generating capacity of a single Measuring Agent, you can combine multiple agents in a cluster using a Cluster Controller.
- Like measuring agents, Cluster Controllers can be hosted in the cloud or on your own infrastructure, as per your requirements.
Proxy Recorder (Optional)
- You can use the Proxy Recorder component in order to develop test scripts by recording HTTP traffic while it transits through it.
- The Proxy Recorder can be run in the cloud, as a service on your own infrastructure or directly on your Desktop using the Desktop Companion.
Typical deployment scenarios
Load Testing using Cloud Credits
The RealLoad portal gives you the ability to launch load generators (Measuring Agents) in the AWS cloud with a click of button and the execute a load test.
Key features and requirements are:
- You’re not required to have an AWS account, as the Measuring Agent is run under RealLoad’s AWS account.
- You pay for the AWS and RealLoad licensing costs using previously purchased Cloud Credits.
- The application to be load tested needs to be reachable from the Measuring Agent’s public IP address, assigned by AWS at launch.

Load Testing by running the Measuring Agent behind perimeter firewall
Using Cloud Credits is not an option if the servers to be performance tested are not exposed to the internet. In this scenario, the Measuring Agent will need to be deployed behind perimeter firewalls as follows:
- In AWS: You can launch our pre-configured AMIs under your AWS account and attach them to your VPCs.
- If preferred, Measuring Agent instances can be launched using our convenient Desktop Companion application.
- If running on non-AWS infrastructure: Install the Measuring Agent on a supported Linux Distribution.
Key features and requirements are:
- The Measuring Agent needs to be reachable from the internet based Portal Server. You’ll need to configure firewall and NAT rules on your perimeter firewall to allow communication.
- You’ll need to update the Measuring Agent software from time to time, to stay compatible with updates on the Portal Server.
- You’ll need to purchase a Load Testing license to suit your load requirements.

Synthetic Monitoring of Internet exposed services
Typically Synthetic monitoring is use to monitor services that are exposed to the internet. RealLoad uses Measuring Agents to implement the monitoring functionality.
We recommend executing Synthetic Monitoring tests from at least 2 Measuring Agents, to cater for transitory local disruptions (like network issues or agent software updates) which might trigger false positive alerts.
There are two types of agents you can use for monitoring purposes:
- Shared Agents: These are Monitoring Agents shared by multiple customers. Using these agents is included in the basic cost of the monitoring service.
- Dedicated Agents: If you need to execute monitoring from a specific location or you don’t want to use a shared agent, we can setup a dedicated agent for you. This will incur additional costs, plz reach out to us to discuss.
Key features and requirements are:
- The application or service to be monitored needs to be reachable from the internet.
- You’ll need to subscribe to a Synthetic Monitoring plan. Reach out to us for pricing.

Synthetic Monitoring of services running behind perimeters firewalls
Should you have the need to monitor services within your perimeter, this can be arranged by deploying Measuring Agents within your networks.
Key features and requirements are:
- You’ll need to deploy two measuring agents behind the firewall perimeter. For AWS deployments your can use our existing AMIs, for other infrastructure install the Measuring Agent on a supported Linux Distribution.
- You’ll need to update the Measuring Agent software from time to time, to stay compatible with updates on the Portal Server.
- The Measuring Agents need to be reachable from the internet based Portal Server. You’ll need to configure firewall and NAT rules on your perimeter firewall to allow communication.
- You’ll need to subscribe to a Synthetic Monitoring plan. Reach out to us for pricing.

2 - Portal Sign Up and Login
To get started you’ll need to setup and account for yourself at the RealLoad portal. See here how…
If you already have an account, you can login at https://portal.realload.com
Signing Up - Free Account Features
In order to login to the portal you’ll first have to setup an account. Go to the portal URL and click on the Sign Up button or go this URL: https://portal.realload.com/SignUp
You’ll need to provide:
- Email address.
- Mobile phone number.
- No credit card required, it’s completely free.
Free Account Features
After sign up, you have access to 2 (shared) Measuring Agents and to a remote HTTP/S Proxy Recorder.
A free account allows you to execute both Synthetic Monitoring Jobs & Load Test Jobs with the following limitations:
- Max Number of Monitoring Jobs: 5
- Min Monitoring Job Execution Interval: 5 minutes
- Max Emails to be configured for Monitoring Alerts: 3
- Max Monitoring Data Storage Time: 1 month
- Max Virtual Users per executed Load Test job: 50 ¹
- Max Load Test job duration: 15 Minutes ¹
- Max Load Test job runs per 24 hours: 12 ¹
- Max disk space storage: 0.5 GBs. This is used to store your test scripts and test results.
- Your Free Account expire after 60 days, after that you have to purchase a license. Expired accounts and their data can be reactivated up to 6 months after expiration by purchasing a (new) license.
¹ = Does not apply for Load Test Jobs executed on Measuring Agents launched by Cloud Credits: in this case there are no such restrictions.
In addition, you will receive at sign up 20 free Cloud Credits, which you can use to launch additional (private) AWS Measuring Agents to perform Load Tests with hundreds of virtual users.
You can add a RealLoad license to your account at any time, even if your account is expired (but no longer than 6 months ago), by purchasing licenses at https://shop.realload.com .
Account deletion
To have your account deleted, please send an email to support@realload.com. We’ll then reach out to you to confirm deletion.
Your account will be immediately disabled and all your data will be removed within 90 days, including backups.
Sign Up Process
Step 1 of 4
Provide your details, including email and mobile number. All data you enter in this form are only required to verify your identity and will not be shared with any third parties.

Step 2 of 4
Validate your email address.

Step 3 of 4
Validate your mobile number

Step 4 of 4
Configure your nickname and password

Welcome Page with Examples
Once you signed up, you will be automatically loggedIn and the welcome page will be displayed.
Three examples are shown which are also available online:
3 - Execute a Simple HTTP/S Test
This section gets you kickstarted with a simple HTTP/S test.
This example shows how a simple HTTP/S Test can be defined as a RealLoad ‘Test’ and executed as both a Load Test Job and a Monitoring Job.
The test sequence is manually entered into the HTTP Test Wizard to keep this example simple. However, you can also record HTTP/S tests using an HTTP/S Proxy Recorder and convert the recording into a HTTP Test Wizard session.
Pre-Requisites
To configure and execute a simple test you’ll need:
- Access to the RealLoad portal. If you haven’t signed up, do so first Sign Up
- Approx. 20..30 minutes of your time
- A cup of tea or coffee
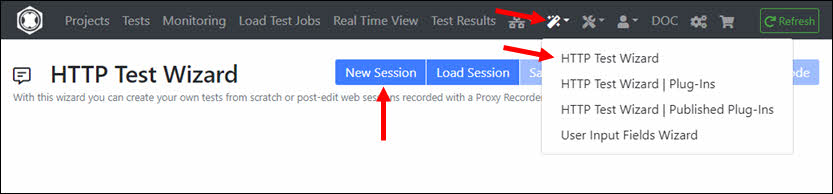
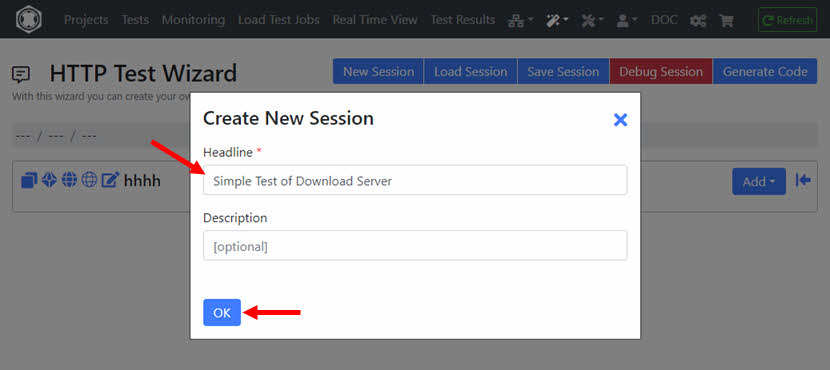
1. Invoke the HTTP Test Wizard and Create a New Session
Enter the Headline that briefly describes what the test does.
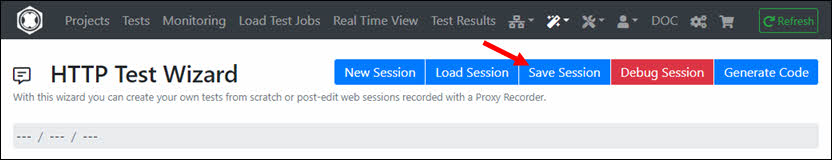
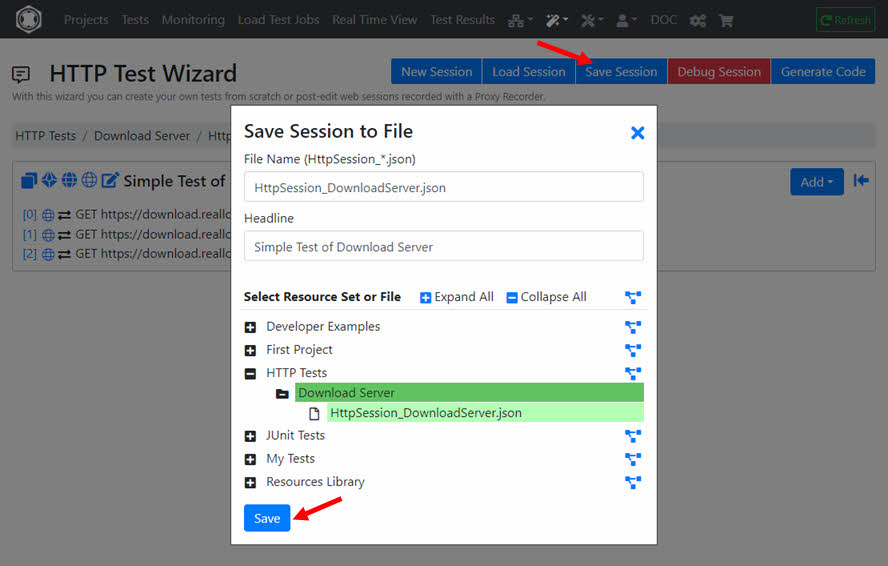
2. Save the (empty) Session
It’s best to save the empty session now. To do this, you must select a Resource Set of a Project.
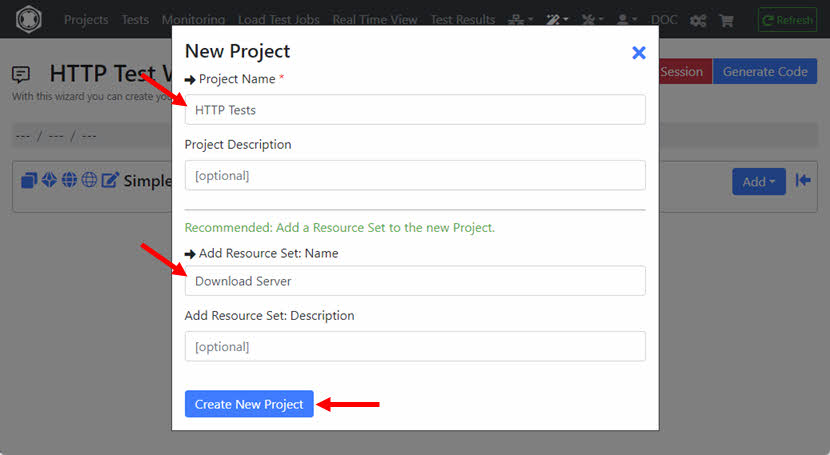
Alternatively, you can also create a new ‘Project’ and/or ‘Resource Set’. ‘Resource Sets’ are something like sub-directories of a Project, which contain all the files necessary to define and execute a test.
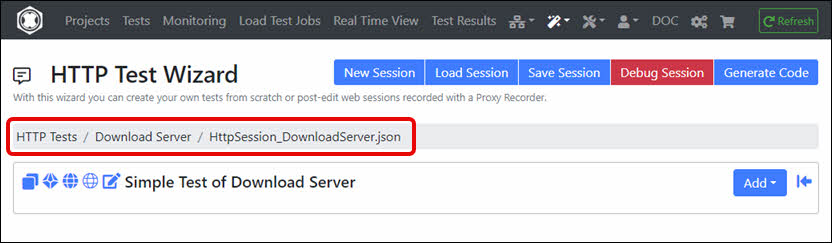
Enter the file name for the session, e.g. HttpSession_TestDownloadServer.json and save the session.
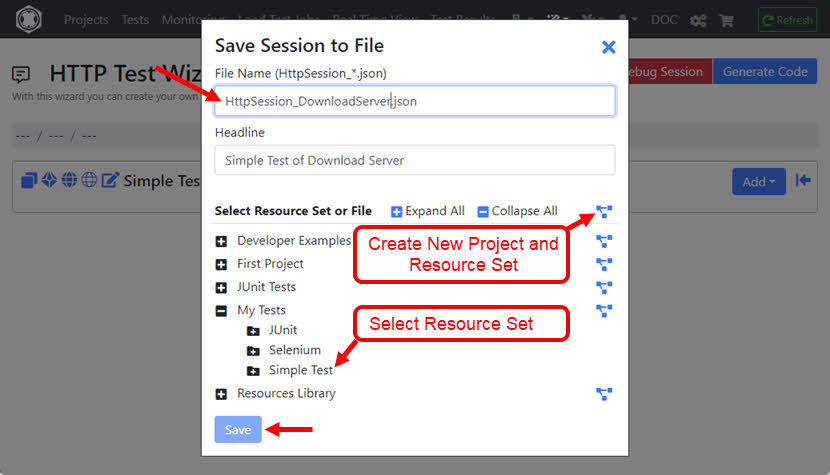
In this example, a new Project named ‘HTTP Tests’ is created which also contains a new Resource Set named ‘Download Server’.
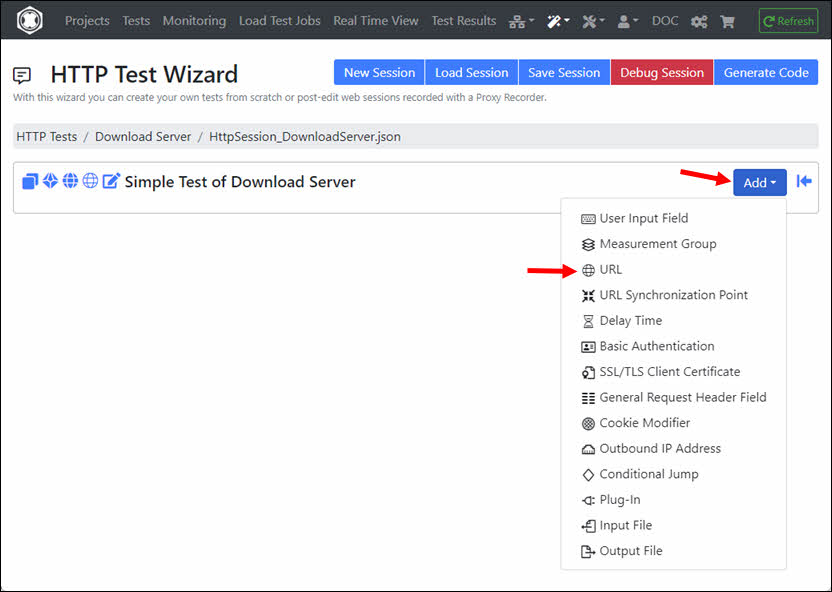
3. Add URLs to the Session
Click on the ‘Add’ dropdown and select ‘URL’.
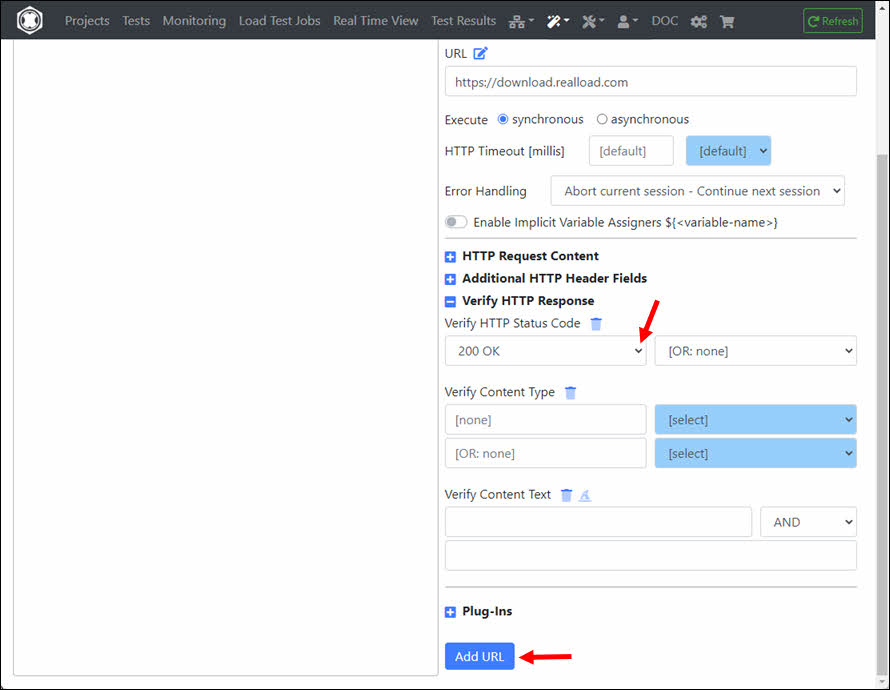
Enter the URL and click on the ‘+’ icon at ‘Verify HTTP Response’.
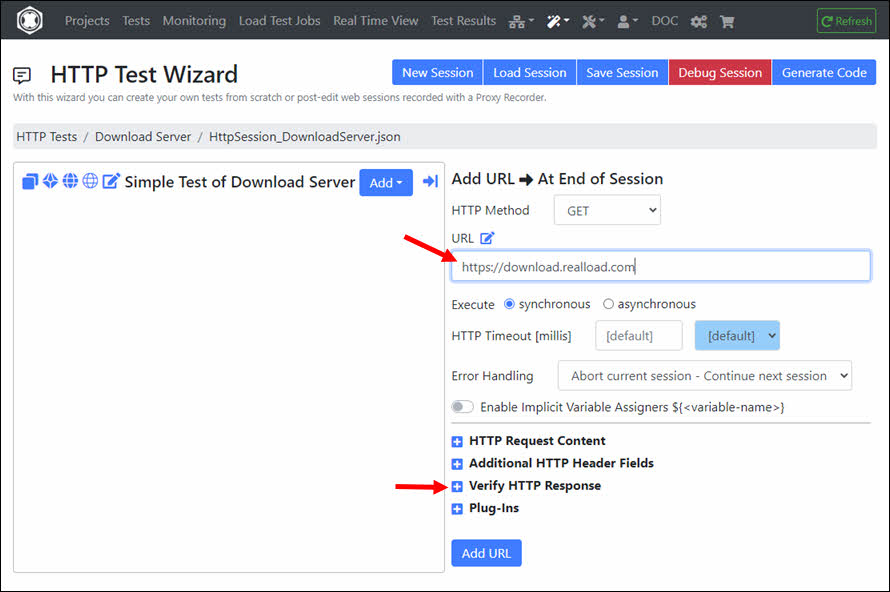
At ‘Verify HTTP Status Code’ select ‘200 OK’ and then click the ‘Add URL’ button.
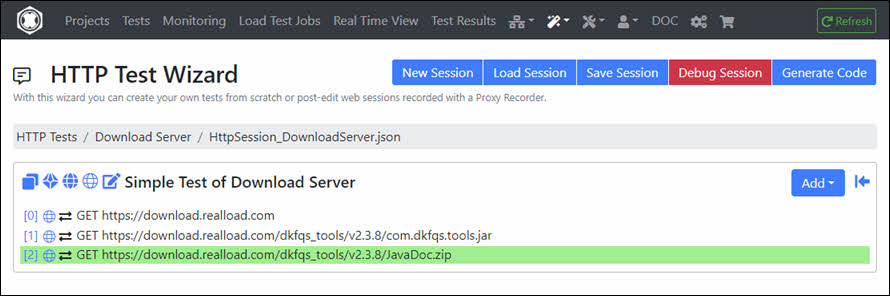
You can then add additional URLs to the session. In this example it looks like this:
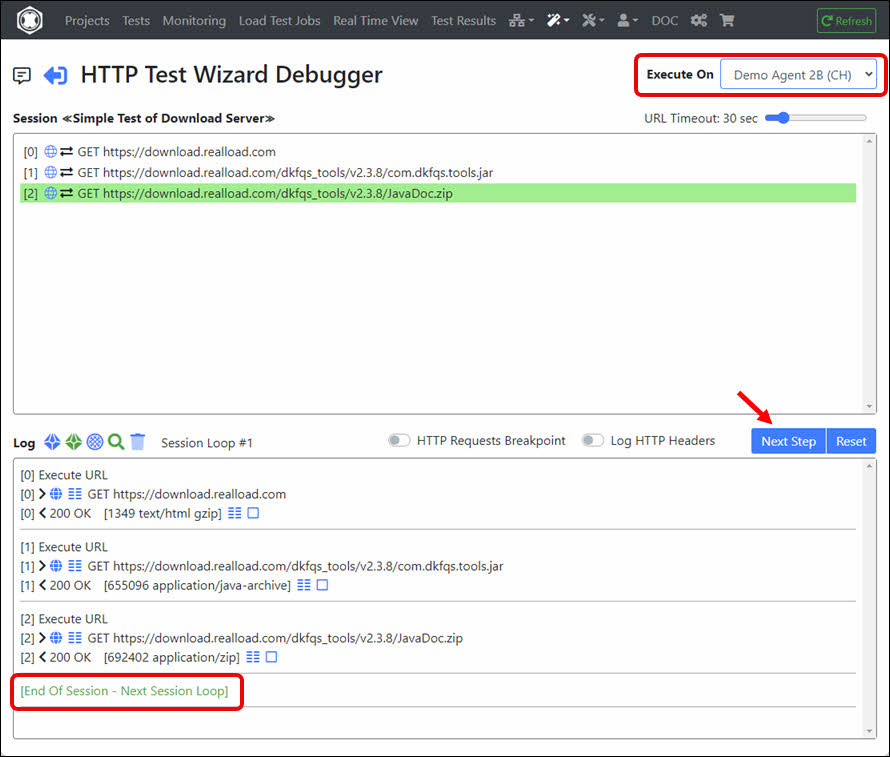
4. Debug the Session
Before converting the session into a RealLoad ‘Test’ you should Debug the Session first. This way you can check whether all URL calls are working correctly. Click ‘Debug Session’.
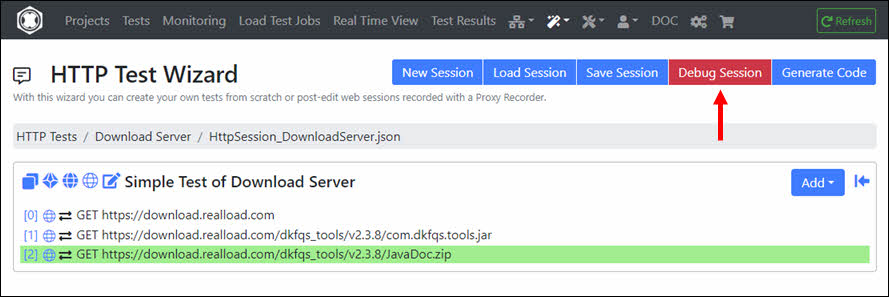
This invokes a powerful Remote Debugger that runs always on a Measuring Agent. As shown at the top right of the following image you can also select an alternative Measuring Agent on which the debugger will run.
In the debugger you can also extract values from HTTP responses and assign them to succeeding HTTP requests, whereby the session is automatically synchronized between the debugger and the HTTP Test Wizard.
In the debugger, click Next Step until all URLs have been executed successfully and the end of the session has been reached - or until an error occurs. If an error occurs, exit the debugger, then repair the URL (= HTTP/S request), and then invoke the debugger again.
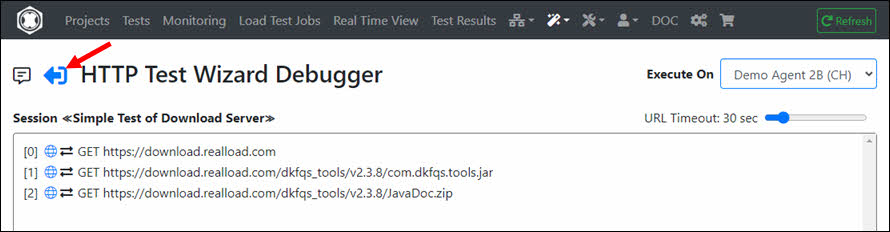
After debugging is successful, return to the HTTP Test Wizard.
5. Save the (debugged) Session
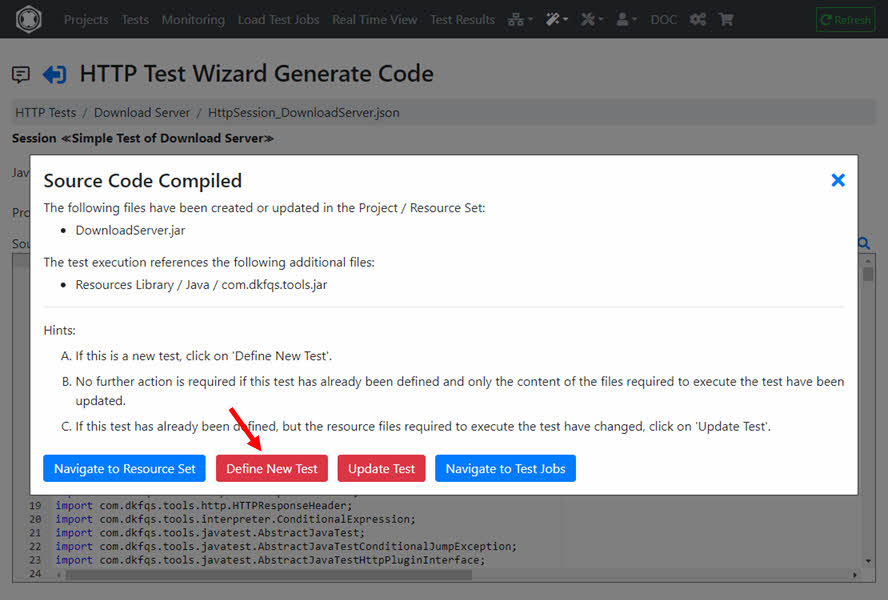
6. Generate and Compile the Code, and Define the RealLoad ‘Test’
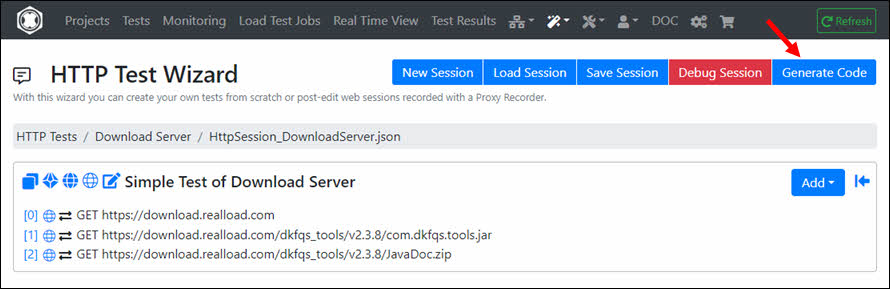
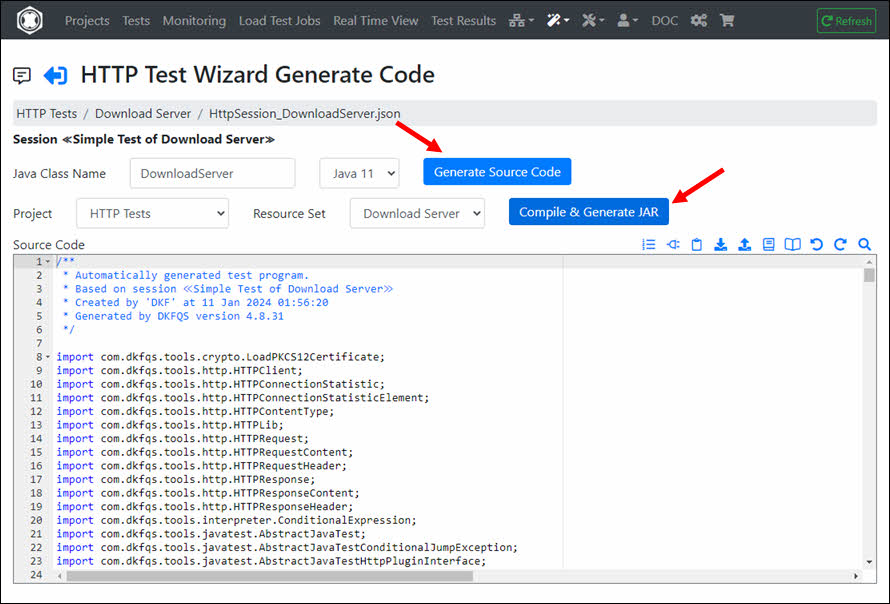
After the source code is compiled, click ‘Define New Test’.
Enter the Test Description, and click ‘Define New Test’.
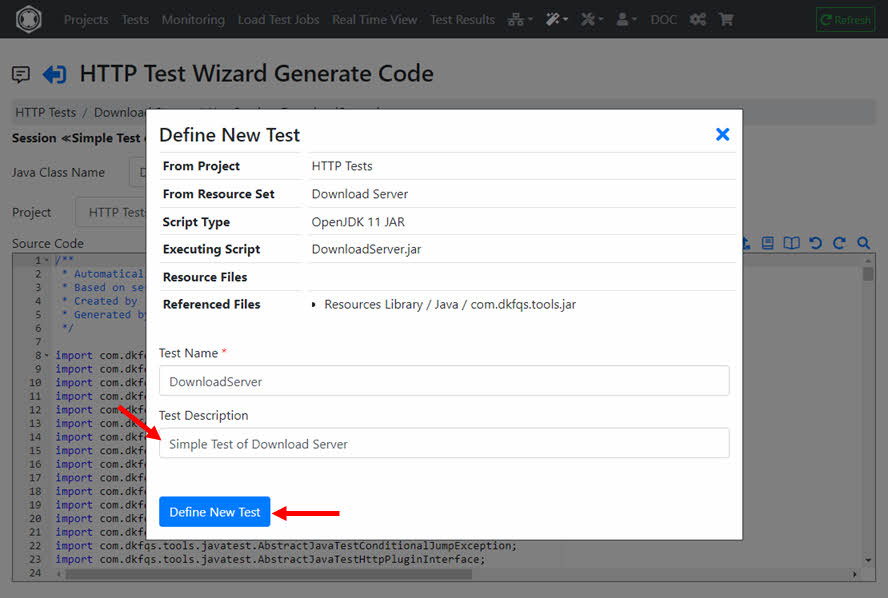
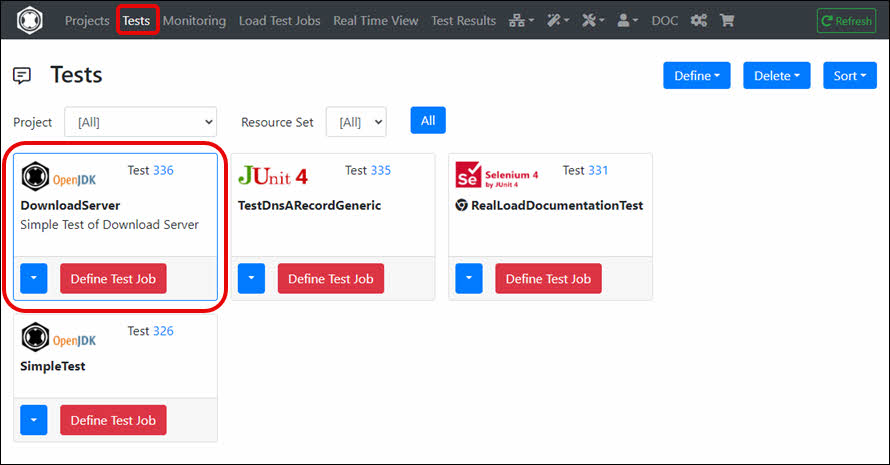
The RealLoad ‘Test’ is now defined. From here you can now create both a Load Test Job and a Monitoring Job.
Note: In case you (later) modify the session in the HTTP Test Wizard, you will have to generate and compile the source code again.
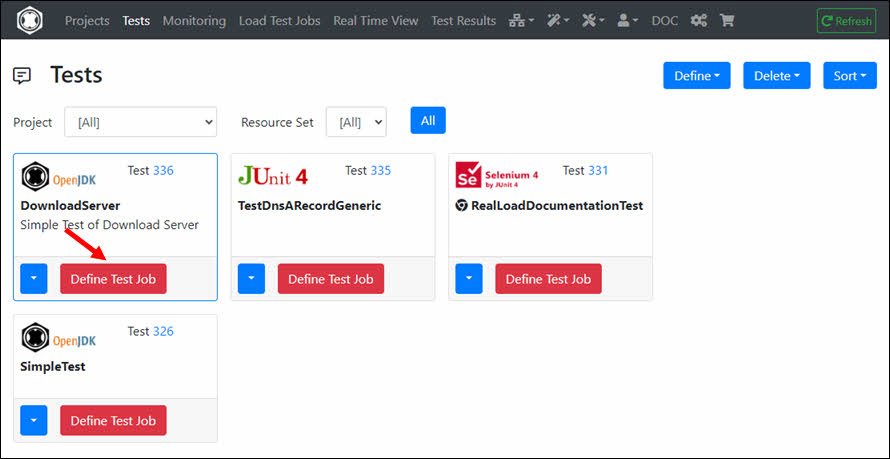
7. Define and Execute a Load Test Job
In the RealLoad ‘Test’ click ‘Define Test Job’.
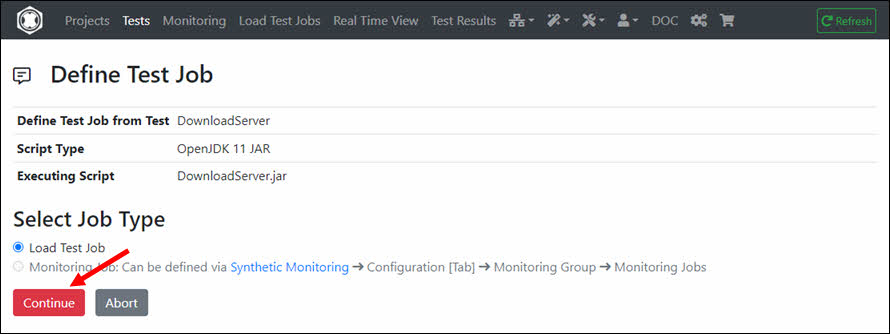
In next menu click ‘Continue’ …
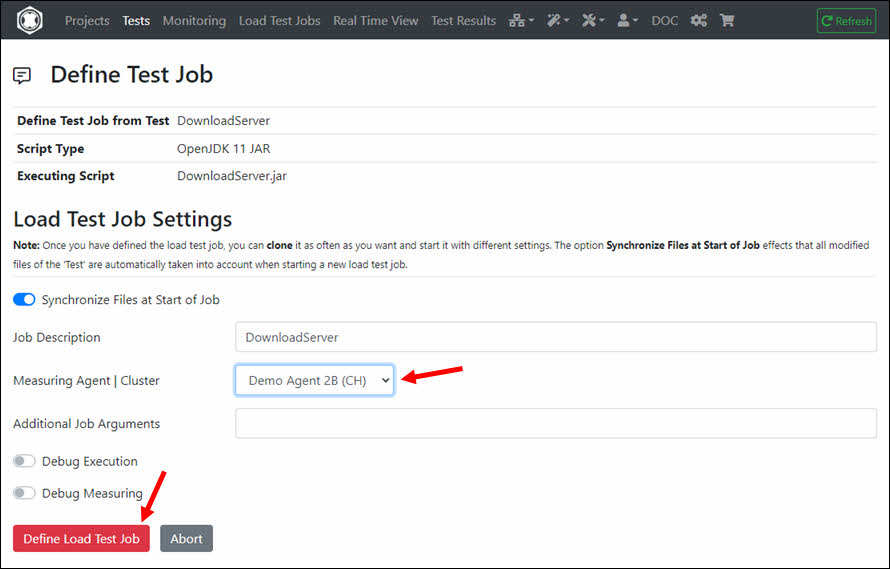
… And select the Measuring Agent on which the Load Test Job will be executed, then click ‘Define Load Test Job’.
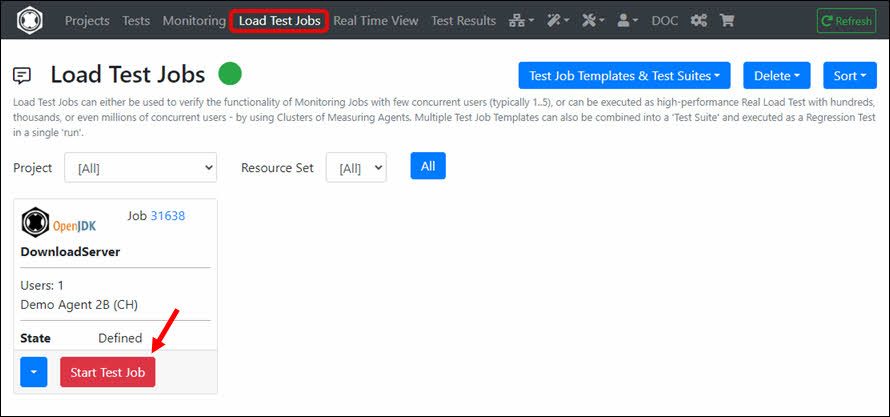
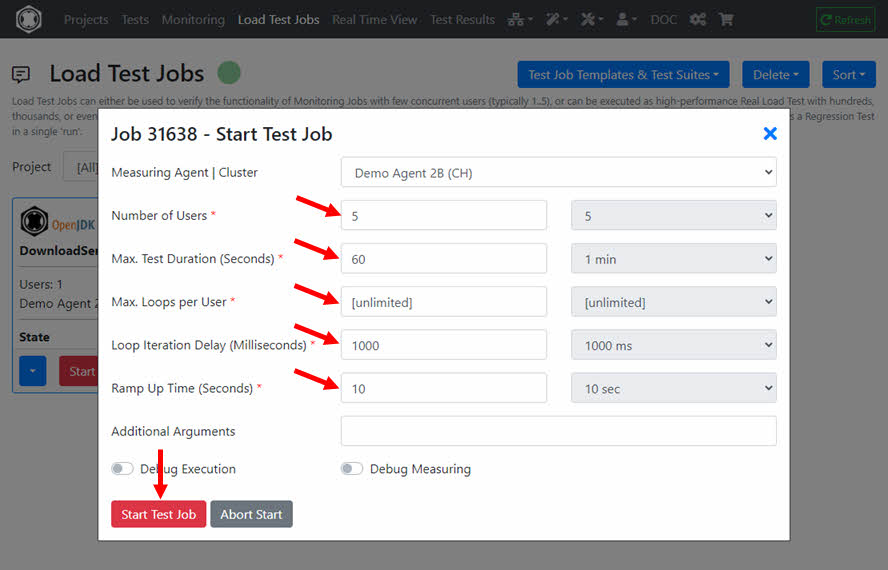
The Load Test Job is now defined. Click ‘Start Test Job’.
Enter the settings of the Load Test Job here and then click ‘Start Test Job’. We recommend the following settings for the first load test run:
- Number of Users: 5
- Max. Test Duration (Seconds): 60
- Max. Loops per User: [unlimited]
- Loop Iteration Delay (Milliseconds): 1000
- Ramp Up Time (Seconds): 10
Limitations if using a Free Account
A free account allows you to execute Load Tests with the following limitations ¹ :
- Max. Load Test Job runs per 24 hours: 12
- Max. Number of (virtual) Users: 50
- Max. Test Duration: 15 Minutes / 900 Seconds
¹ = Does not apply for Load Test Jobs executed on Measuring Agents launched by Cloud Credits: in this case there are no such restrictions.
You can add a Real Load license to your account at any time by purchasing it in our shop https://shop.realload.com .
After a few seconds the Load Test Job is in the state ‘Running’. Click ‘Monitor Jobs’.
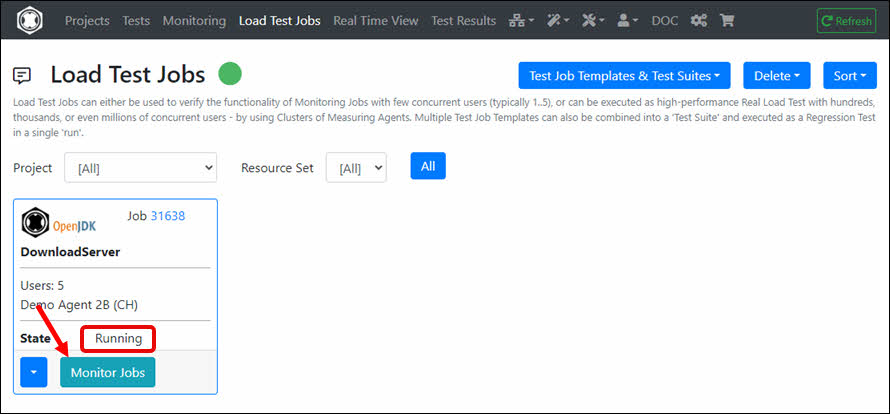
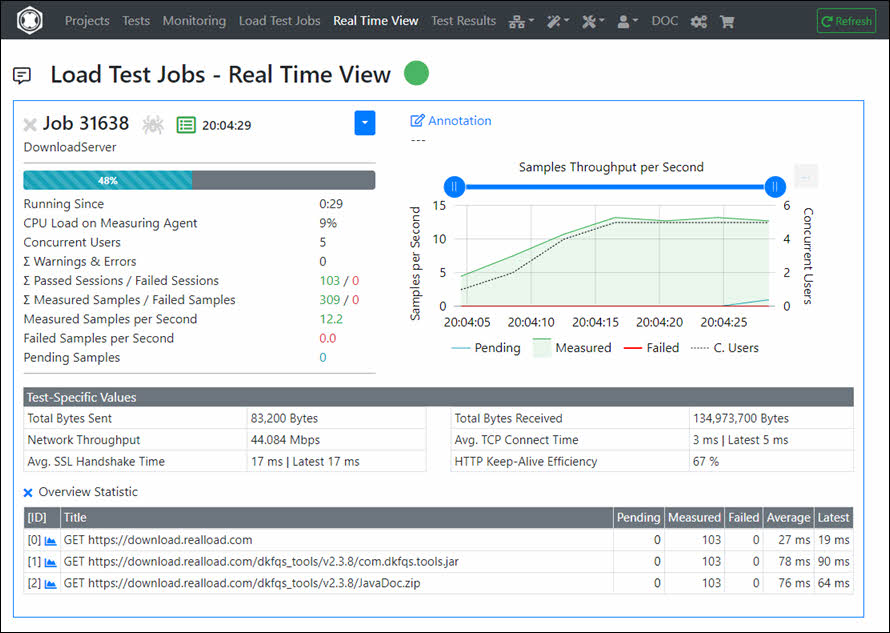
The real-time data of the running Load Test Job is now displayed.
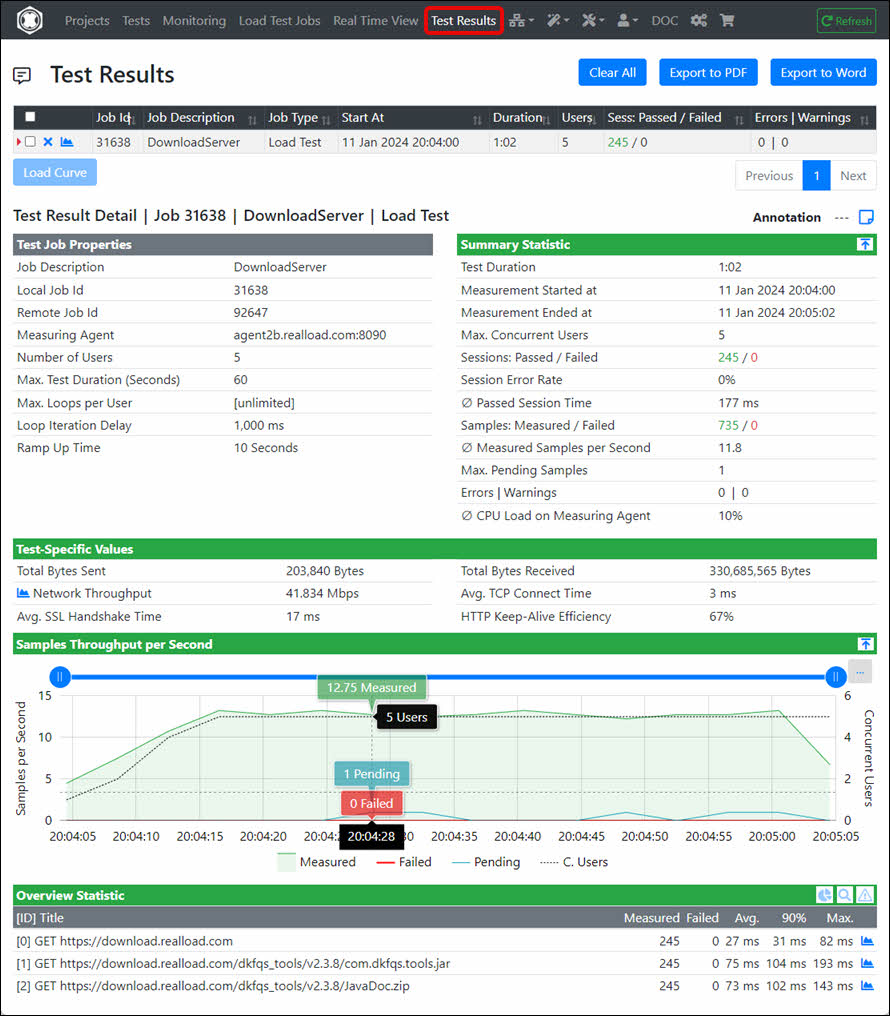
Click on ‘Analyze Result’ after the Load Test Job is completed.
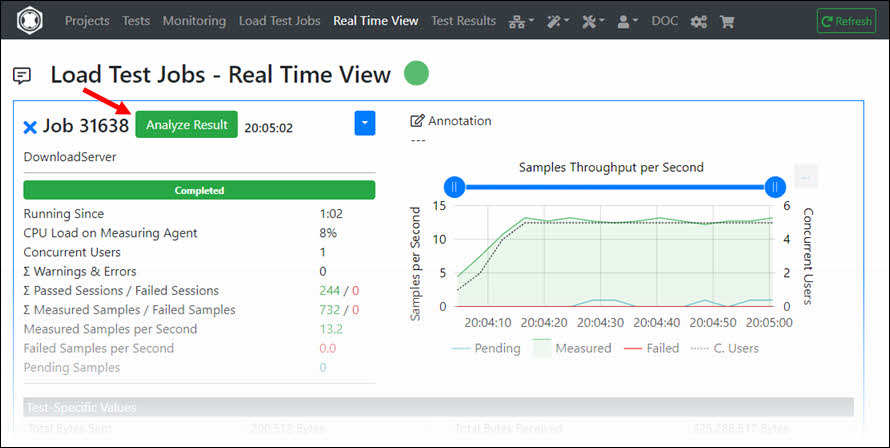
The Load Test Job result is then displayed.
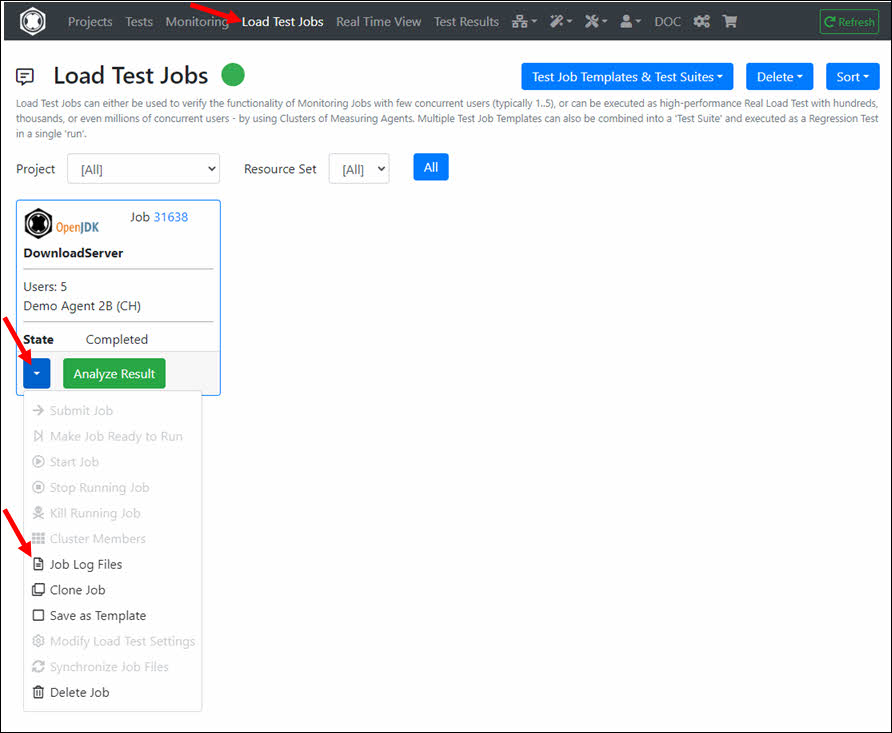
To view the Job Output Files navigate to ‘Load Test Jobs’ and click in the dropdown of the Job on ‘Job Log Files’.
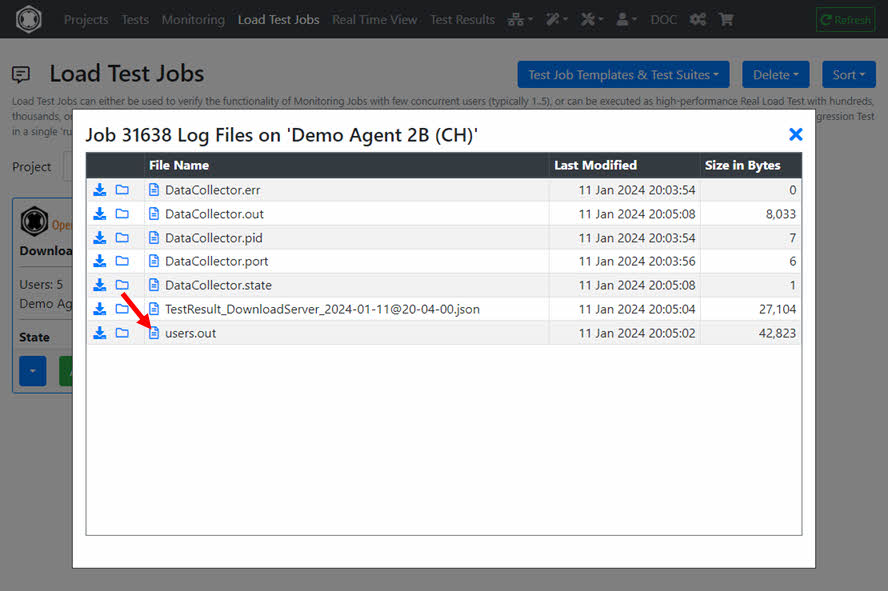
Select the file users.out which contains the Log Output of the Job.
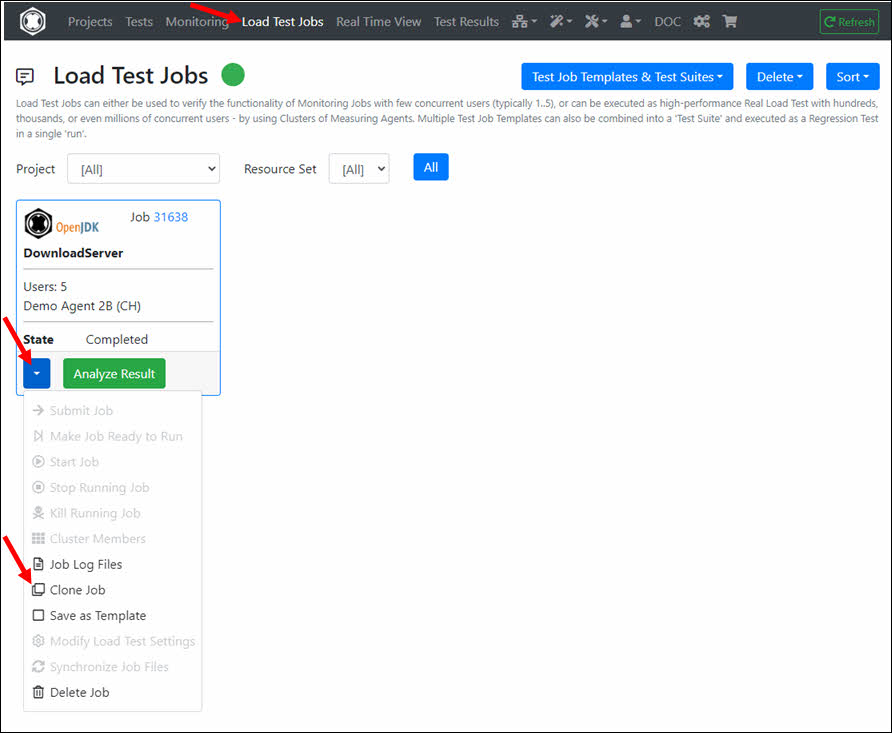
If you would like to run the Load Test Job again with the same or changed settings, click on ‘Clone Job’ in the Job dropdown and then start the cloned job.
8. Define a Monitoring Job
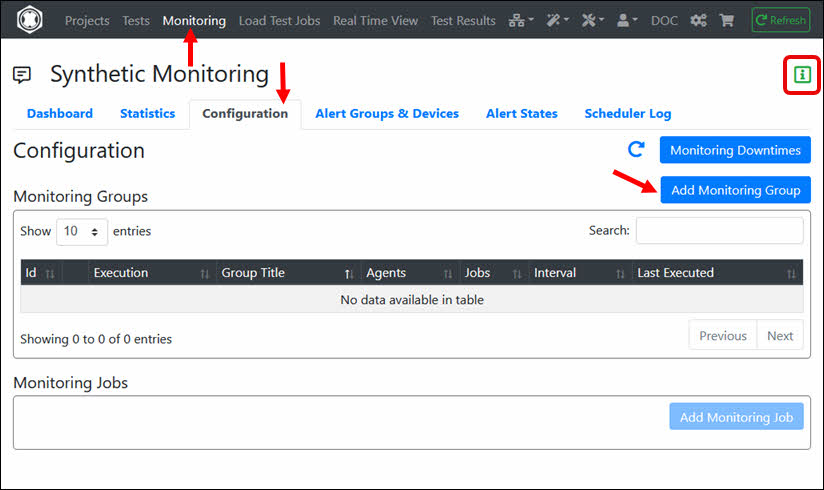
If this is your first Monitoring Job, you must first create a Monitoring Group. Navigate to Monitoring, click the ‘Configuration’ tab and then click ‘Add Monitoring Group’. There is also a help available for configuring the Synthetic Monitoring.
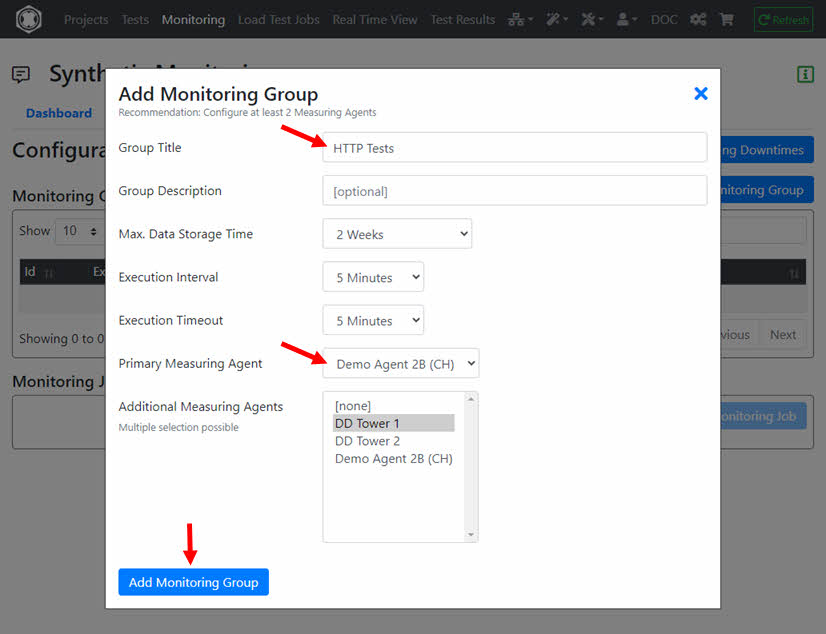
Enter the ‘Group Title’ and select at least one ‘Measuring Agent’ on which the Monitoring Job(s) will be executed. Then click ‘Add Monitoring Group’.
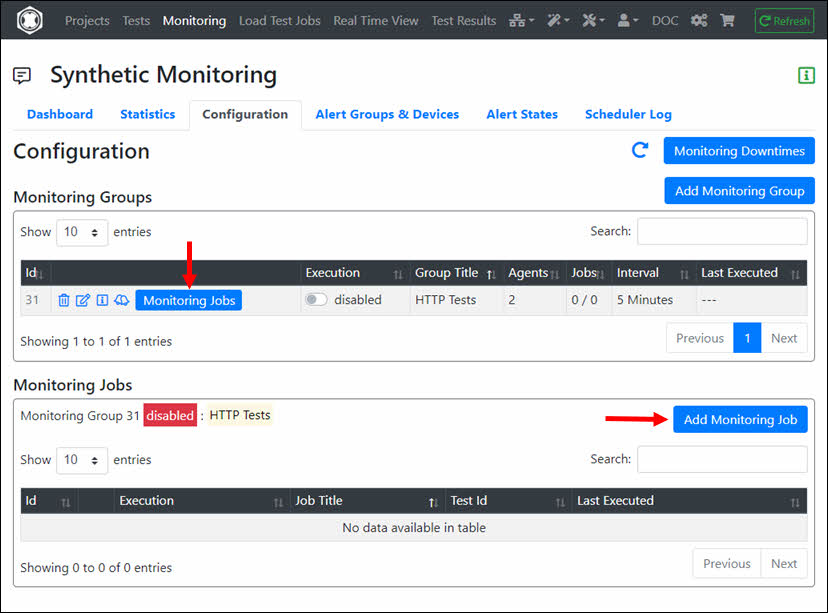
In the ‘Monitoring Group’ click ‘Monitoring Jobs’ and then click ‘Add Monitoring Job’.
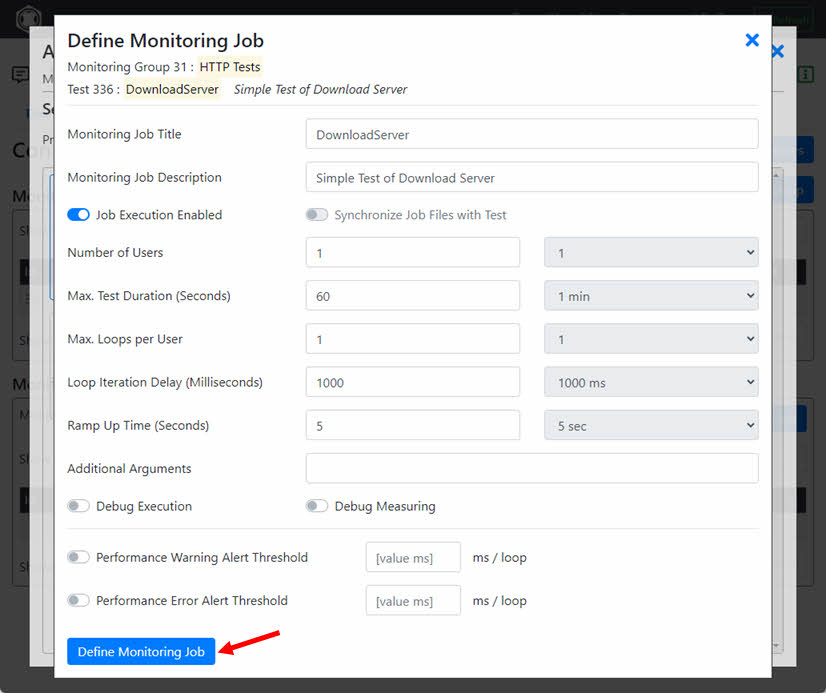
Select the ‘Test’ of the Monitoring Job.
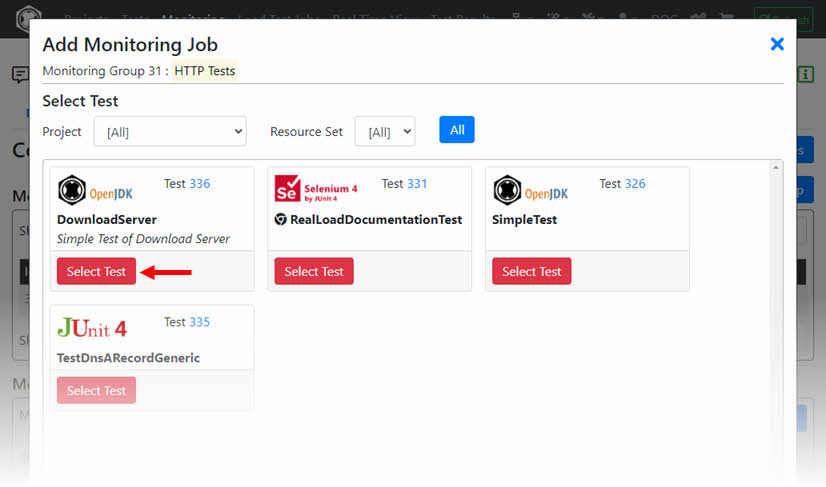
Click ‘Define Monitoring Job’.
Enable the execution of the Monitoring Group and navigate to ‘Dashboard’.
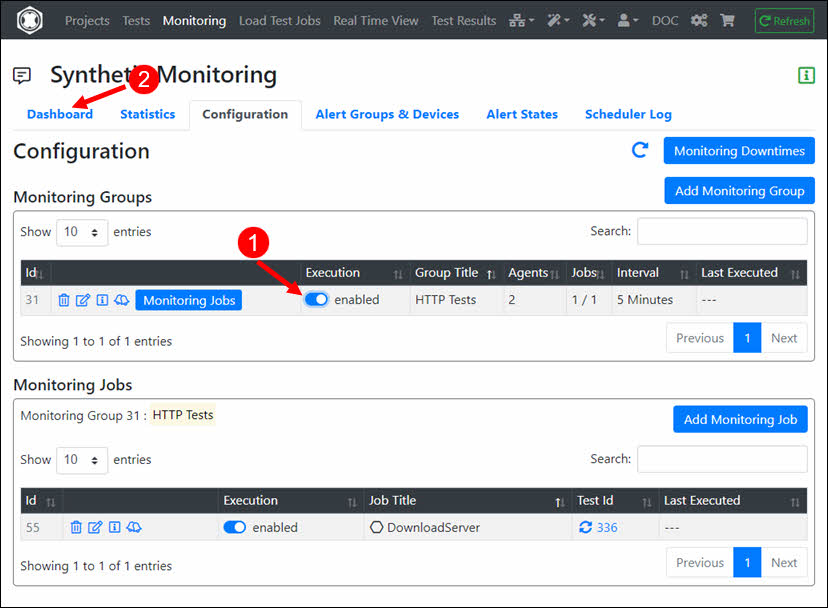
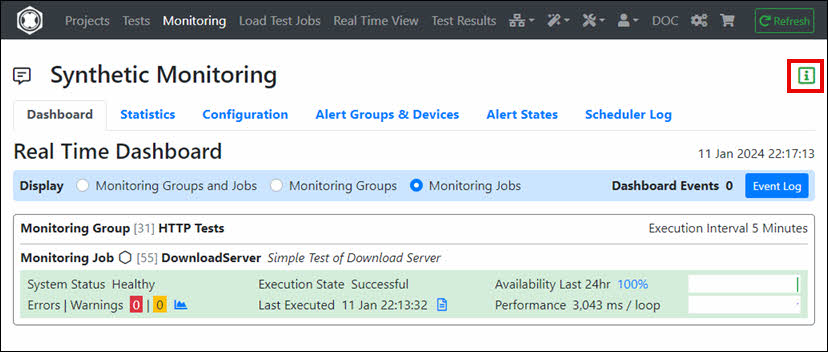
The Monitoring Job is now defined and will be executed periodically. For additional help configuring monitoring (e.g. adding ‘Alert Devices’), see Monitoring Help.
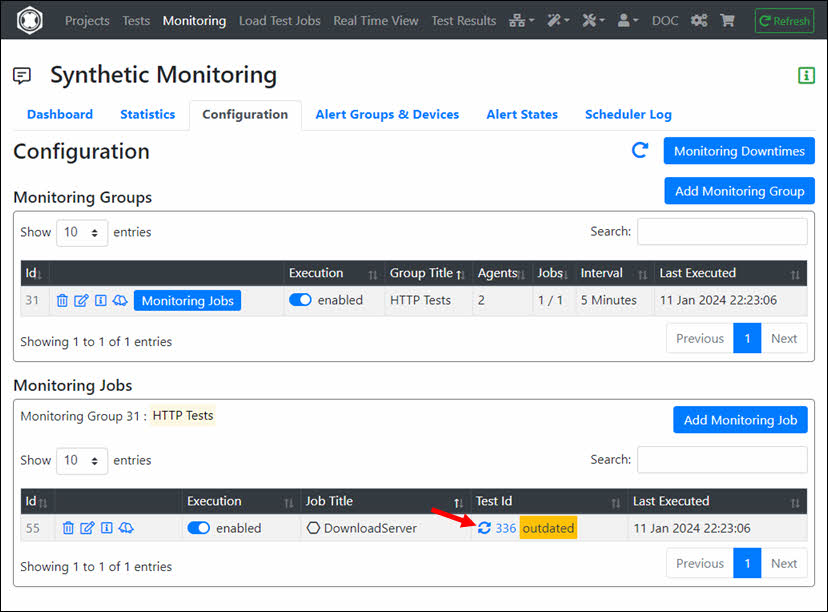
Tip: If you modify the RealLoad ‘Test’, the corresponding Monitoring Job is not automatically updated to avoid unexpected corruption of the Monitoring Job. After you have verified the modified ‘Test’ by running a small Load Test Job, you must manually update the Monitoring Job.
Done, congrats, you’ve run your first test with Real Load.
9. Conclusion and Prospects
As you have seen, a RealLoad Test can be run as both a Load Test Job and a Monitoring Job.
This example was deliberately kept simple so that you can become familiar with the RealLoad product. To create a test with a web browser session across multiple web pages, you can use
a Remote Proxy Recorder to record the test case and then convert the recording into an HTTP Test Wizard session.
Additionally, a Test Job Template can also be defined from any ‘Load Test Job’, which can then be part of a Test Suite. This means that you can add multiple ‘Test Job Templates’ to a Test Suite and execute them in a single run as a Regression Test.
To learn more, we recommend you read the User Guide. There you will find detailed documentation on the steps described in this document.
4 - Convert a Selenium IDE Test to a RealLoad Test
This example shows how to convert a Selenium IDE Test to RealLoad Test.
This example shows how a Selenium IDE Test - which was recorded with a Chrome or Firefox web browser - can be converted into a RealLoad ‘Test’.
The converted RealLoad ‘Test’ can then be executed both as a Load Test Job and as a Monitoring Job.
In addition, the converted test can also be part of a Test Suite for performing Regression Tests.
In most cases, the conversion can be done easily with just a few mouse clicks - without the need for any special settings.
At the end of each executed test run (of the converted RealLoad test), a final screenshot of the simulated web browser session is
taken for each virtual user so that you can check whether the web browser session of the virtual user has been fully executed.
Tip: If possible, always use the Chrome web browser for Selenium IDE recording, as Chrome sessions are simulated much faster (= more realistic) than Firefox sessions.
Pre-requisites
To configure and execute this test you’ll need:
- Access to the Real Load portal. If you haven’t signed up, do so first: Sign Up
- Approx. 20..30 minutes of your time
- A cup of tea or coffee
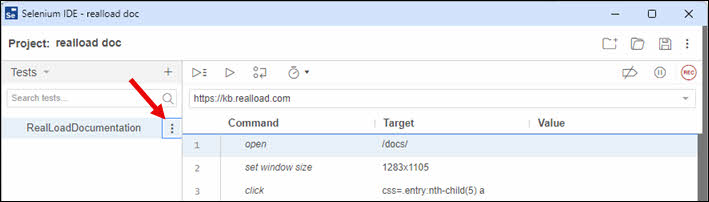
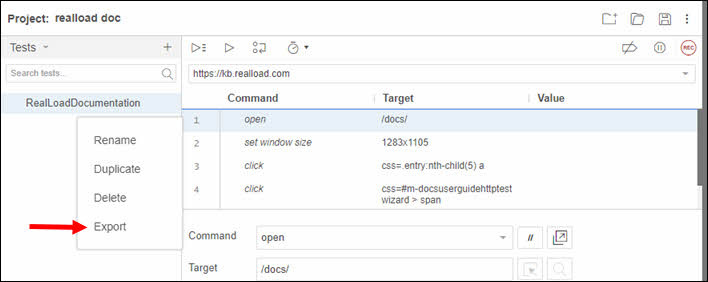
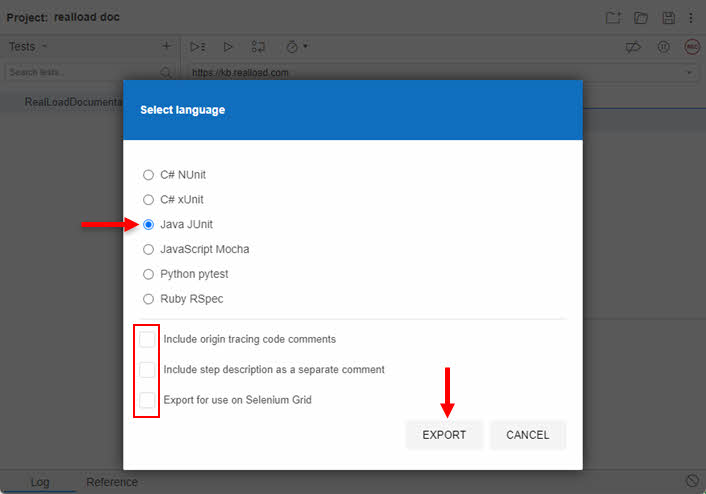
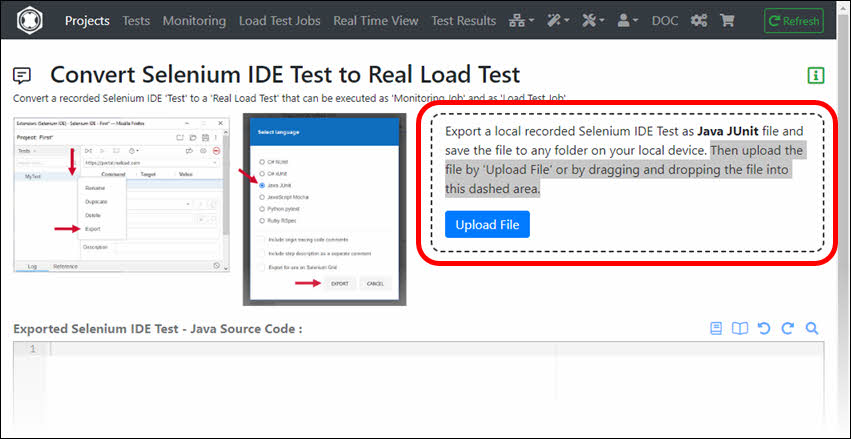
1. Export the Selenium IDE Test as JUnit Test
Export the your recorded Selenium IDE Test as Java JUnit file and save the file to any folder on your local device.
Note that the 3-dot dropdown icon may initially be hidden and may only appear when you are near to the Selenium ‘Test Case’ area. Do not choose any export option.
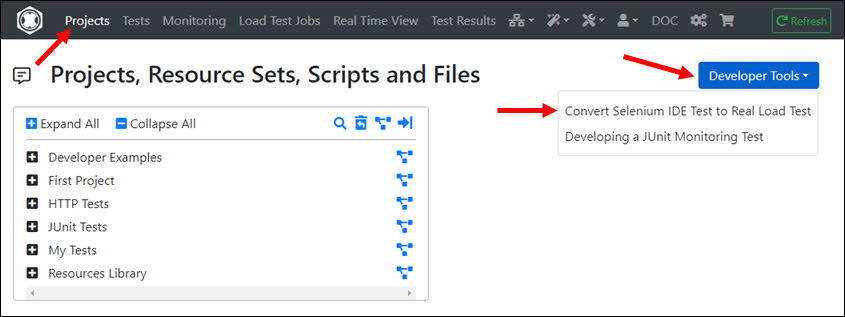
2. Upload the exported Selenium JUnit File
At Projects menu click on the ‘Developer Tools’ dropdown and select ‘Convert Selenium IDE Test to Real Load Test’.
Then upload the file by ‘Upload File’ or by dragging and dropping the file into the dashed area.
3. Convert the Uploaded JUnit File
Click on the ‘Convert’ button after uploading the file. The converted Java code is then displayed. Then click on the ‘Save & Compile’ button.
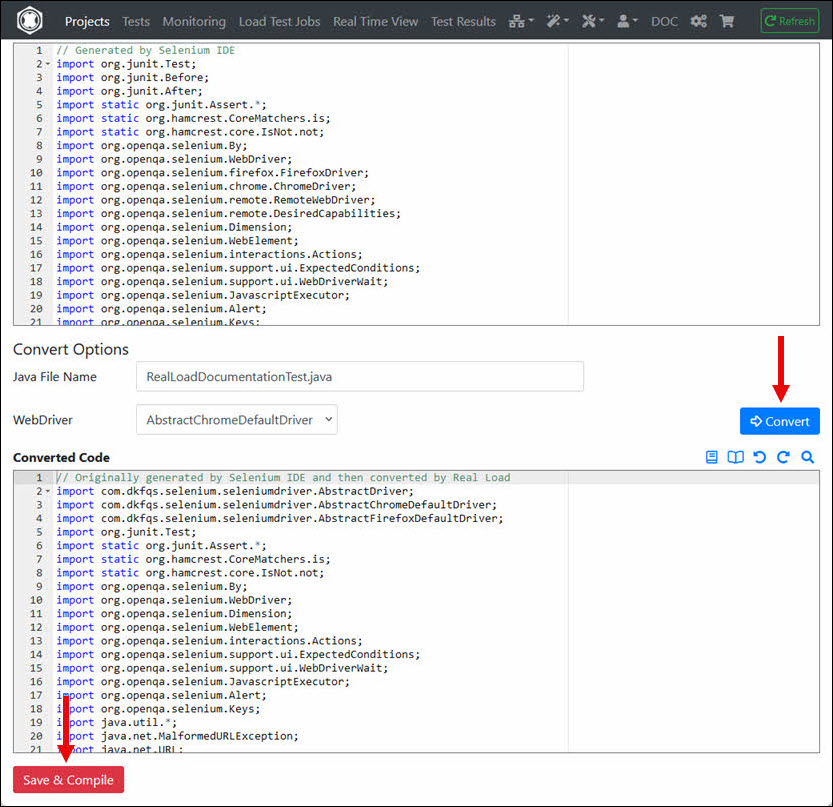
You have to save the converted code in a Resource Set of a Project. You can also first create a new Project with a new Resource Set.
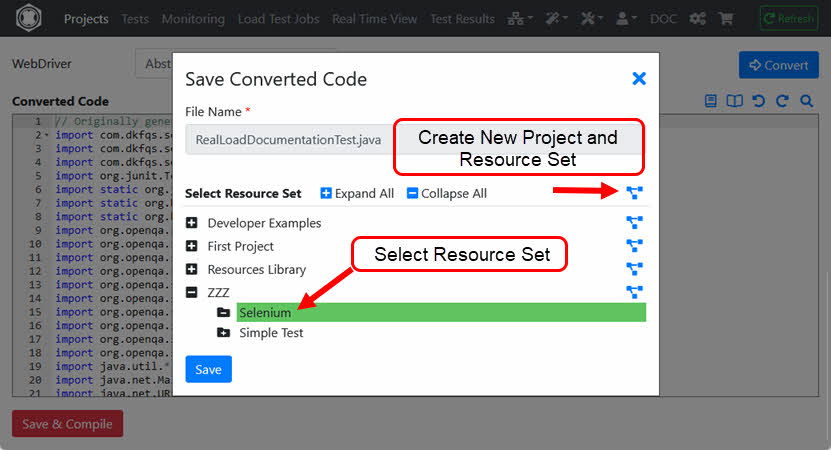
After saving the converted code, you will be automatically redirected to the Compile Java File dialog.
4. Compile the Converted JUnit File
The JAR files required to compile are already preselected, i.e. you need only click the ‘Compile’ button.
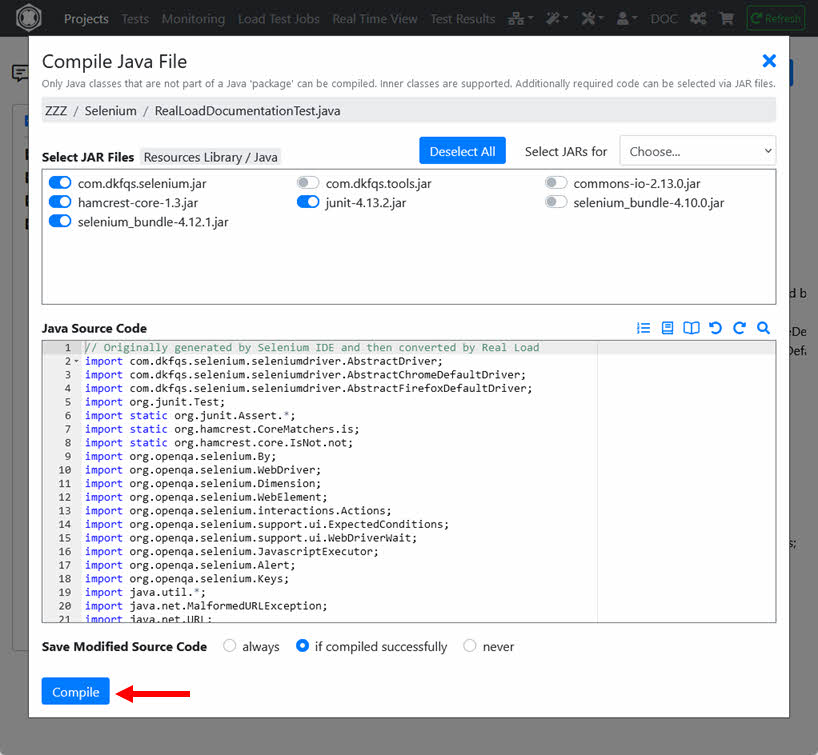
After successful compilation, click ‘Define or Update Selenium by JUnit Test’.
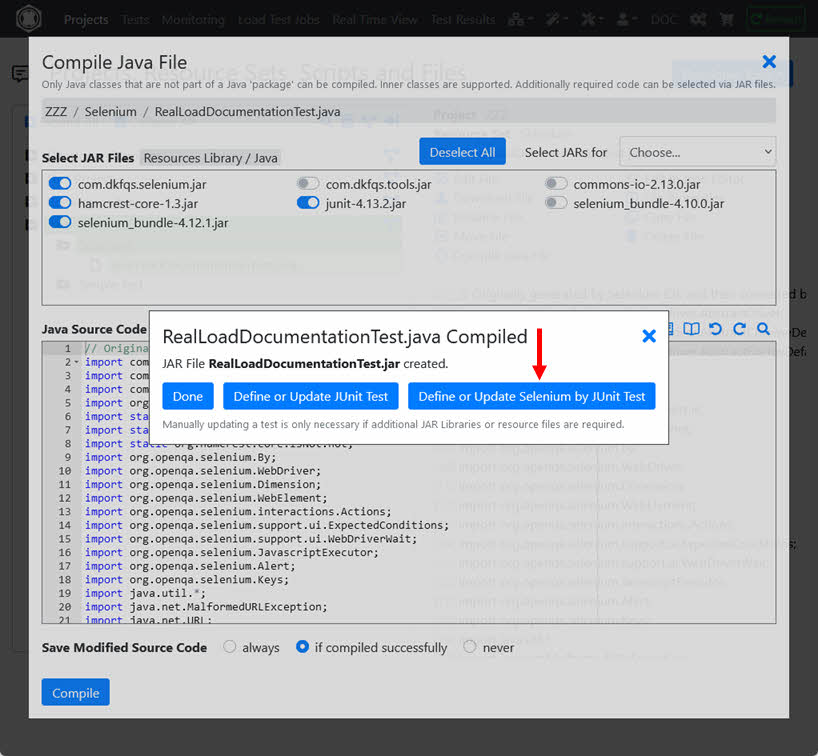
You will then be automatically redirected to the Define JUnit & Selenium Test dialog.
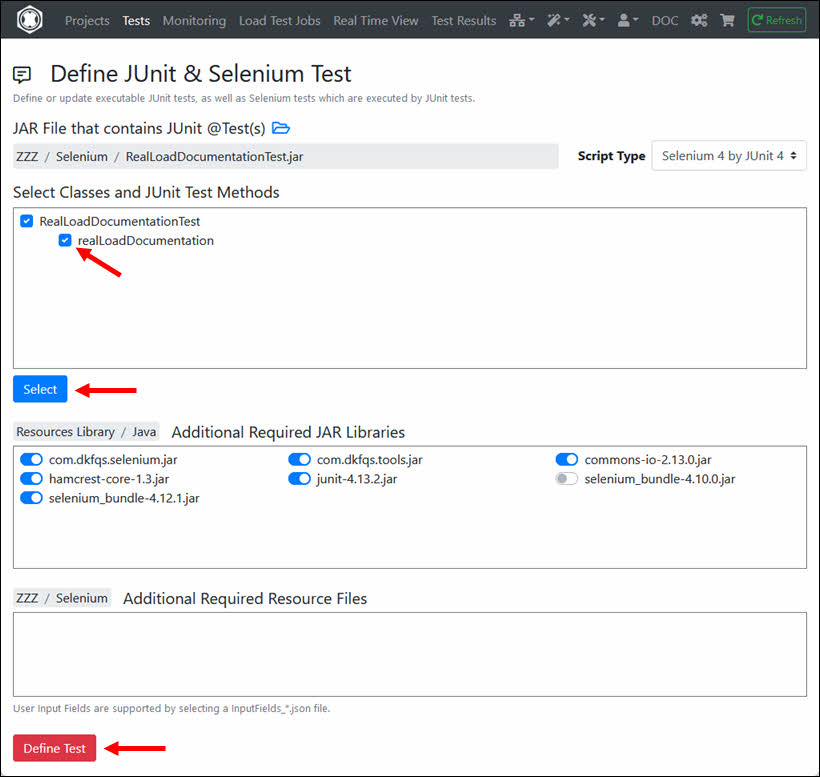
5. Define the Selenium RealLoad ‘Test’
Select the JUnit @Test method (in this case only one will be shown) and click ‘Define Test’.
In an intermediate step you can enter an (optional) test description.
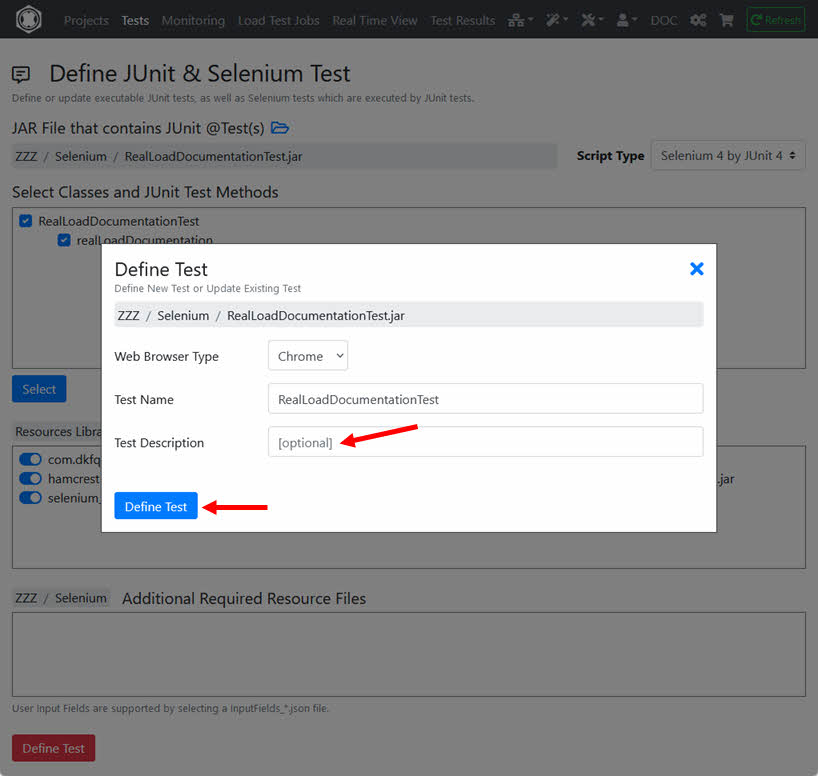
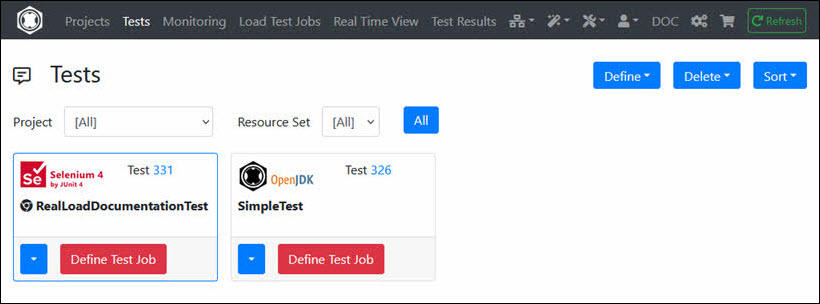
Now the Selenium RealLoad ‘Test’ is defined from which you can define a Load Test Job and/or a Monitoring Job.
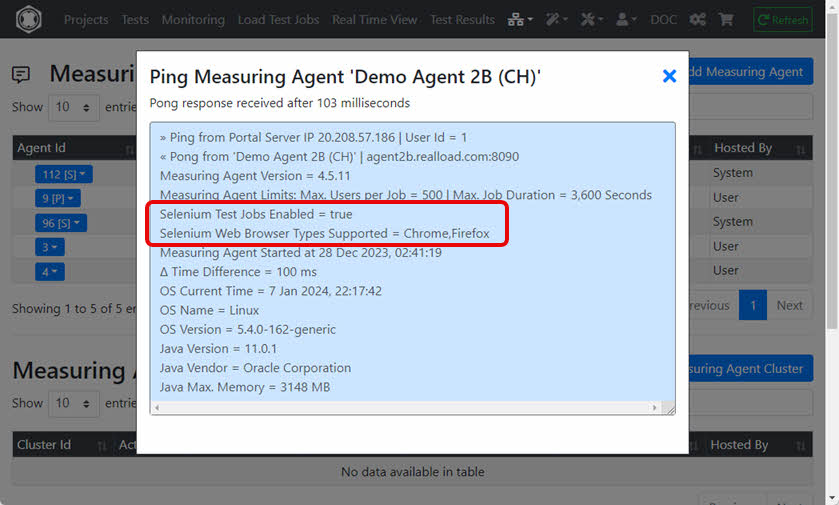
6. Note about Measuring Agents
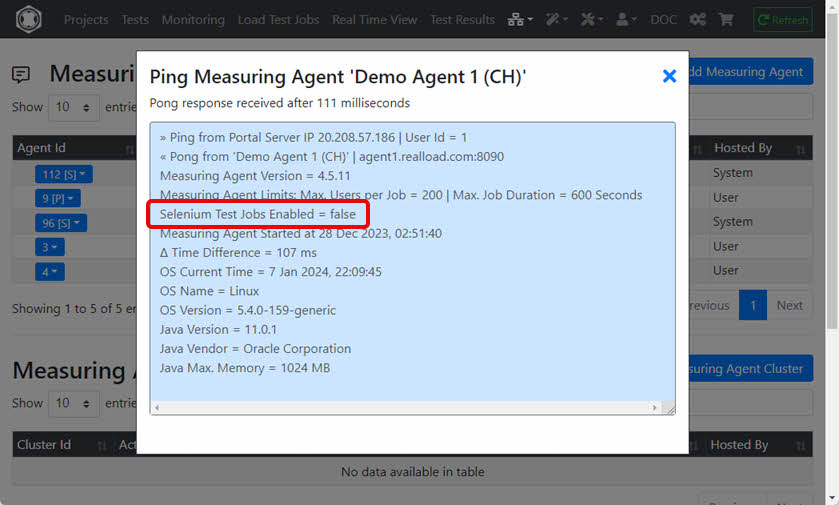
Please note that not all Measuring Agents support the execution of Selenium jobs. You can ‘ping’ a Measuring Agent at application level to find out whether Selenium jobs are supported:
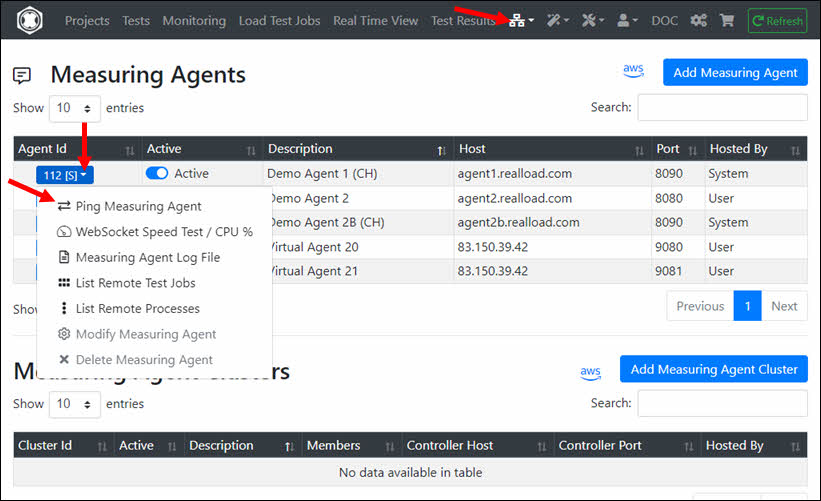
Example 1: Measuring Agent ‘Demo Agent 1 (CH)’ does not support Selenium jobs
Example 2: Measuring Agent ‘Demo Agent 2B (CH)’ supports Selenium jobs