In this section you’ll find the latest RealLoad documentation.
If you need help or would like to provide feedback on product documentation, please email us at support@realload.com .
This is the multi-page printable view of this section. Click here to print.
In this section you’ll find the latest RealLoad documentation.
If you need help or would like to provide feedback on product documentation, please email us at support@realload.com .
RealLoad is an Enterprise Tool to perform next generation Load Testing, Regression Testing, and Synthetic Monitoring.
Due to the universal product architecture, a Test of any Type supported by RealLoad can be executed as:
The following Types of Tests are supported::
Regardless of what type of test you are running, all measured data are displayed directly in real time in form of statistics and charts.
All work steps can be carried out within the web interface of the RealLoad Portal which:
In addition, using the RealLoad Portal offers many other advantages, for example:
Complete Overview of All Product Features
Many larger companies that provide web services that have hundreds or thousands of users logged in at the same time have started combining synthetic monitoring and regression testing with load testing.
For example, if an average of 2000 real users are logged in at the same time, it doesn’t matter if a monitoring job with 100 virtual users is running concurrently in parallel.
However, the data measured in this way are much more meaningful than a test that only runs with a single user, as rarely occurring errors can be identified better and faster. In addition, percentile statistics are also available for each individual test run. This allows performance outliers to be better identified and evaluated.
Another reason to run monitoring jobs with many virtual users is when several servers are combined behind a load balancer. If one of these servers becomes unstable or slow, a monitoring job that only runs with one user will often not detect this - or detect it much too late.
‘RealLoad Tests’ are universal, abstract tests which can created from any type of test. All types of tests can be executed as:
Creating a ‘RealLoad Test’ is usually easy and supported by wizards and powerful dialogs.
The following Types of Tests are supported:


All core components are independent OS processes that can be executed on Linux and Windows:
¹ = Available as public AWS/EC2 image
Using locally installed RealLoad applications is optional, but can be quite useful:
The use of RealLoad browser extensions is optional, but allows you to conveniently control the recording of a web surfing session in combination with a Remote HTTP/S Proxy Recorder.
This section of the documentation will walk you through the first steps in order to getting started with the RealLoad Product.
Follow the next sections of the document and you should be able to run your first basic test script using the SaaS Evaluation scenario within 20 minutes.
Let us know if encounter any issues while getting started, as that will help us updating this documentation to make it as clear and user friendly as possible. Please email us at support@realload.com
First of all you’ll have to decide which RealLoad deployment type better suits your needs. These guidelines should assist you in making an informed decision.
There a few components that make up the RealLoad solution. Most components are available under an SaaS model which doesn’t require any infrastructure commitment from your side.
If required by security or other constraints, some or all components can be deployed on your own infrastructure. Please reach out to us to discuss requirements if you’re planning to go down this road.
The key components that make up RealLoad’s solution are:
There are 2 options for your to run AWS cloud based Measuring Agents:
- Using our Cloud Credits: The relevant Virtual Machines are spun up from our portal under our own AWS account and you pay a usage fee using Cloud Credits you’ve previously purchased from us.
- By starting pre-configured AWS AMIs under your own AWS account. You’ll be charged directly for AWS related costs.
The RealLoad portal gives you the ability to launch load generators (Measuring Agents) in the AWS cloud with a click of button and the execute a load test.
Key features and requirements are:
- You’re not required to have an AWS account, as the Measuring Agent is run under RealLoad’s AWS account.
- You pay for the AWS and RealLoad licensing costs using previously purchased Cloud Credits.
- The application to be load tested needs to be reachable from the Measuring Agent’s public IP address, assigned by AWS at launch.

Using Cloud Credits is not an option if the servers to be performance tested are not exposed to the internet. In this scenario, the Measuring Agent will need to be deployed behind perimeter firewalls as follows:
Key features and requirements are:
- The Measuring Agent needs to be reachable from the internet based Portal Server. You’ll need to configure firewall and NAT rules on your perimeter firewall to allow communication.
- You’ll need to update the Measuring Agent software from time to time, to stay compatible with updates on the Portal Server.
- You’ll need to purchase a Load Testing license to suit your load requirements.

Typically Synthetic monitoring is use to monitor services that are exposed to the internet. RealLoad uses Measuring Agents to implement the monitoring functionality.
We recommend executing Synthetic Monitoring tests from at least 2 Measuring Agents, to cater for transitory local disruptions (like network issues or agent software updates) which might trigger false positive alerts.
There are two types of agents you can use for monitoring purposes:
Key features and requirements are:
- The application or service to be monitored needs to be reachable from the internet.
- You’ll need to subscribe to a Synthetic Monitoring plan. Reach out to us for pricing.

Should you have the need to monitor services within your perimeter, this can be arranged by deploying Measuring Agents within your networks.
Key features and requirements are:
- You’ll need to deploy two measuring agents behind the firewall perimeter. For AWS deployments your can use our existing AMIs, for other infrastructure install the Measuring Agent on a supported Linux Distribution.
- You’ll need to update the Measuring Agent software from time to time, to stay compatible with updates on the Portal Server.
- The Measuring Agents need to be reachable from the internet based Portal Server. You’ll need to configure firewall and NAT rules on your perimeter firewall to allow communication.
- You’ll need to subscribe to a Synthetic Monitoring plan. Reach out to us for pricing.

If you already have an account, you can login at https://portal.realload.com
In order to login to the portal you’ll first have to setup an account. Go to the portal URL and click on the Sign Up button or go this URL: https://portal.realload.com/SignUp
You’ll need to provide:
After sign up, you have access to 2 (shared) Measuring Agents and to a remote HTTP/S Proxy Recorder.
A free account allows you to execute both Synthetic Monitoring Jobs & Load Test Jobs with the following limitations:
¹ = Does not apply for Load Test Jobs executed on Measuring Agents launched by Cloud Credits: in this case there are no such restrictions.
In addition, you will receive at sign up 20 free Cloud Credits, which you can use to launch additional (private) AWS Measuring Agents to perform Load Tests with hundreds of virtual users.
You can add a RealLoad license to your account at any time, even if your account is expired (but no longer than 6 months ago), by purchasing licenses at https://shop.realload.com .
To have your account deleted, please send an email to support@realload.com. We’ll then reach out to you to confirm deletion.
Your account will be immediately disabled and all your data will be removed within 90 days, including backups.
Provide your details, including email and mobile number. All data you enter in this form are only required to verify your identity and will not be shared with any third parties.

Validate your email address.

Validate your mobile number

Configure your nickname and password

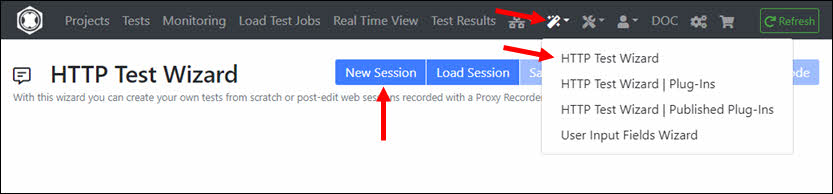
Once you signed up, you will be automatically loggedIn and the welcome page will be displayed. Three examples are shown which are also available online:
This example shows how a simple HTTP/S Test can be defined as a RealLoad ‘Test’ and executed as both a Load Test Job and a Monitoring Job.
The test sequence is manually entered into the HTTP Test Wizard to keep this example simple. However, you can also record HTTP/S tests using an HTTP/S Proxy Recorder and convert the recording into a HTTP Test Wizard session.
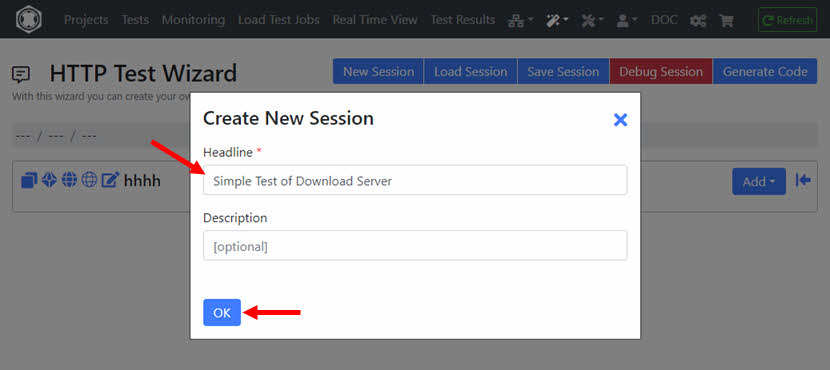
To configure and execute a simple test you’ll need:
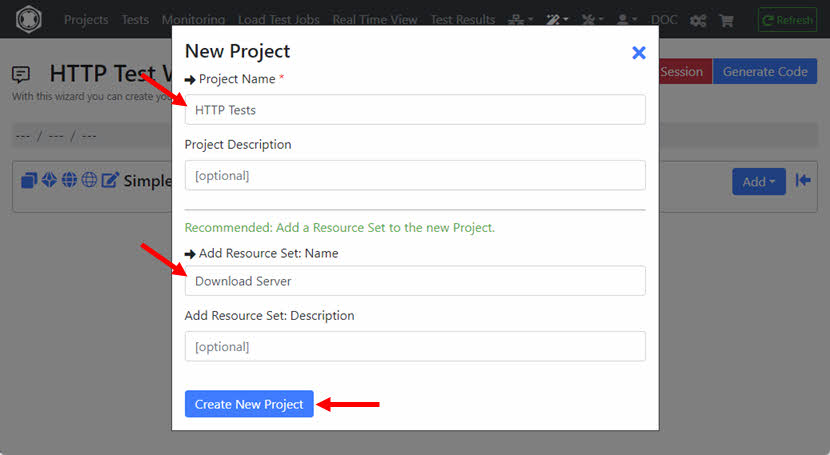
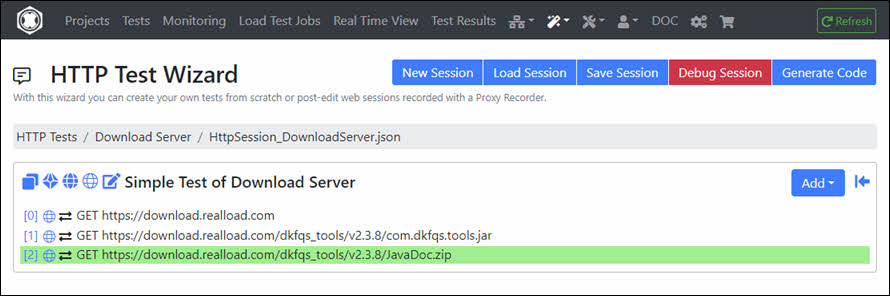
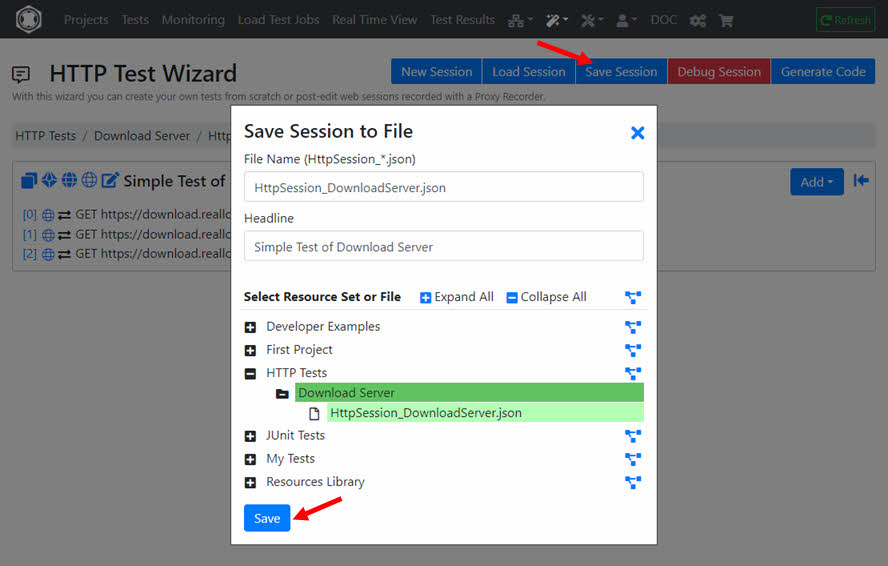
Enter the Headline that briefly describes what the test does.
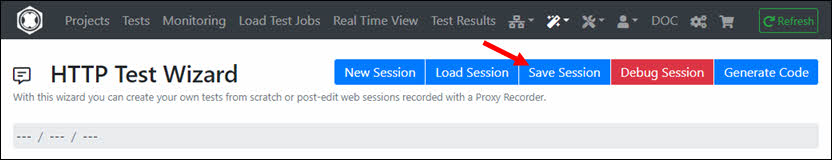
It’s best to save the empty session now. To do this, you must select a Resource Set of a Project. Alternatively, you can also create a new ‘Project’ and/or ‘Resource Set’. ‘Resource Sets’ are something like sub-directories of a Project, which contain all the files necessary to define and execute a test.
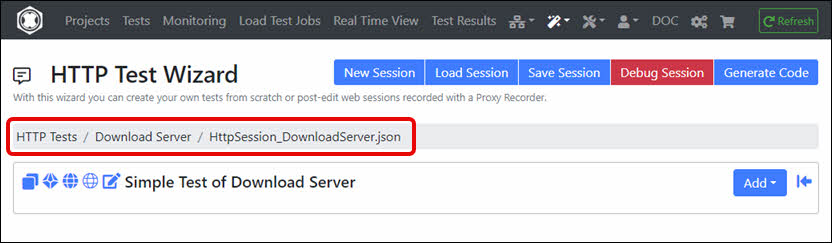
Enter the file name for the session, e.g. HttpSession_TestDownloadServer.json and save the session.
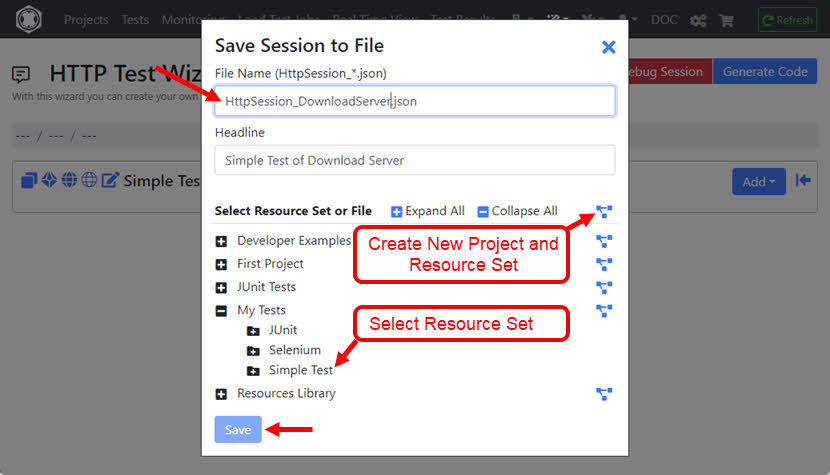
In this example, a new Project named ‘HTTP Tests’ is created which also contains a new Resource Set named ‘Download Server’.
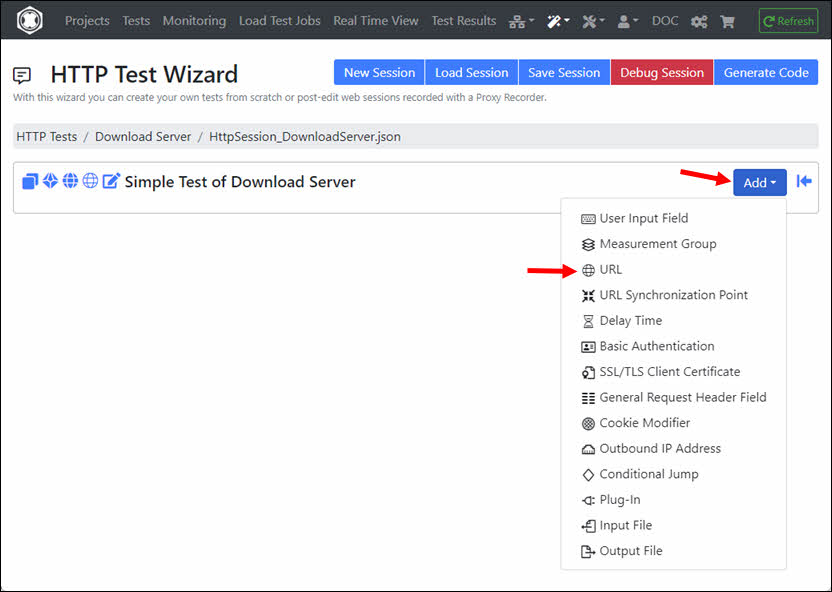
Click on the ‘Add’ dropdown and select ‘URL’.
Enter the URL and click on the ‘+’ icon at ‘Verify HTTP Response’.
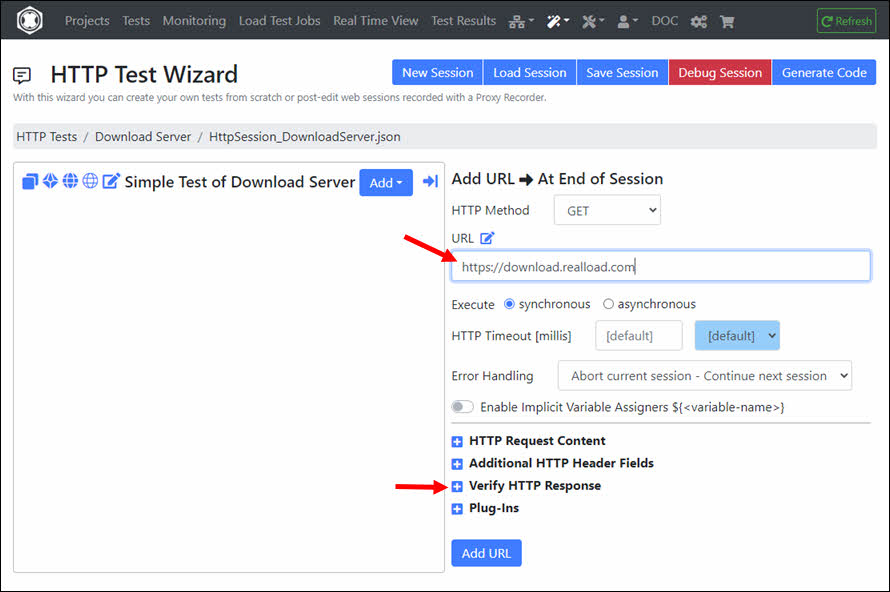
At ‘Verify HTTP Status Code’ select ‘200 OK’ and then click the ‘Add URL’ button.
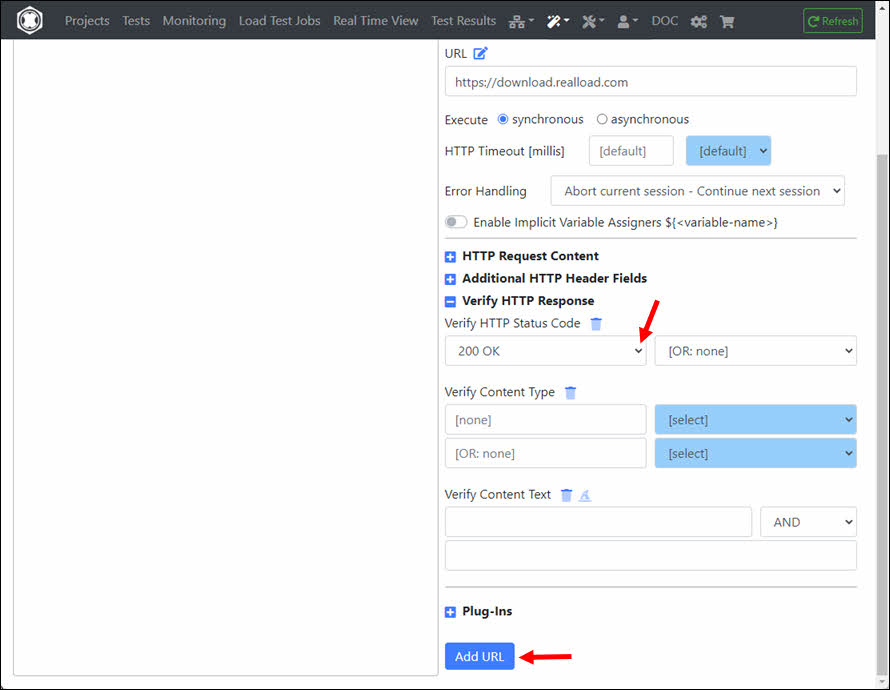
You can then add additional URLs to the session. In this example it looks like this:
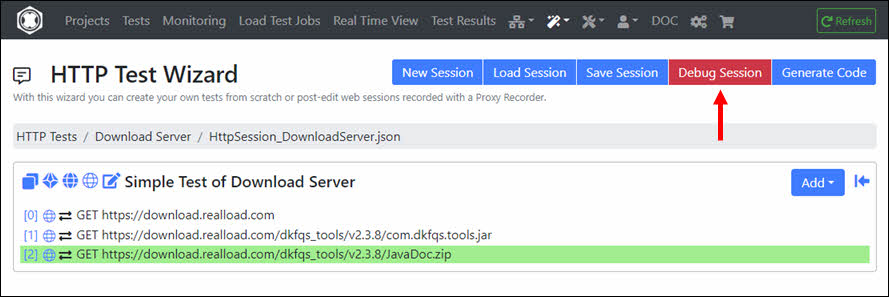
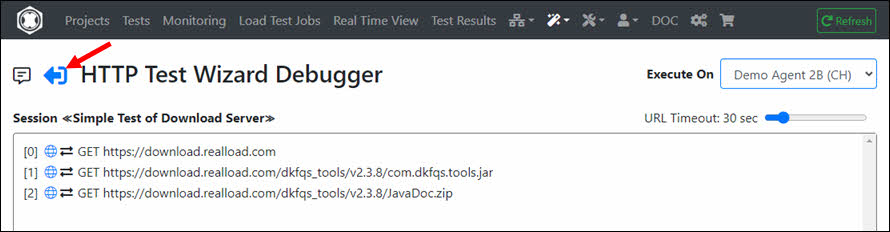
Before converting the session into a RealLoad ‘Test’ you should Debug the Session first. This way you can check whether all URL calls are working correctly. Click ‘Debug Session’.
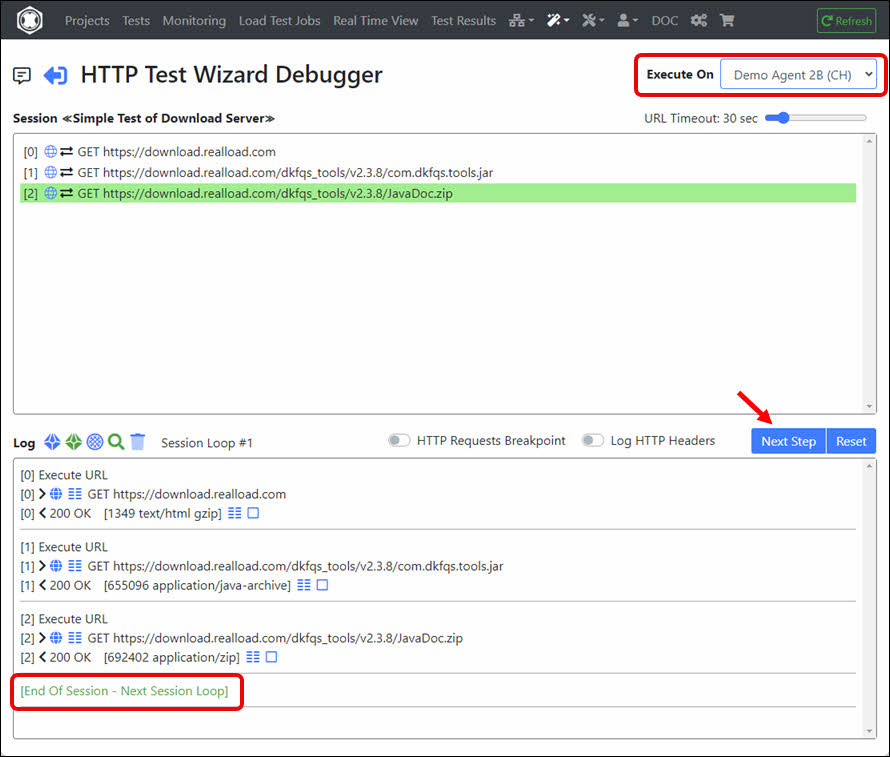
This invokes a powerful Remote Debugger that runs always on a Measuring Agent. As shown at the top right of the following image you can also select an alternative Measuring Agent on which the debugger will run.
In the debugger you can also extract values from HTTP responses and assign them to succeeding HTTP requests, whereby the session is automatically synchronized between the debugger and the HTTP Test Wizard.
In the debugger, click Next Step until all URLs have been executed successfully and the end of the session has been reached - or until an error occurs. If an error occurs, exit the debugger, then repair the URL (= HTTP/S request), and then invoke the debugger again.
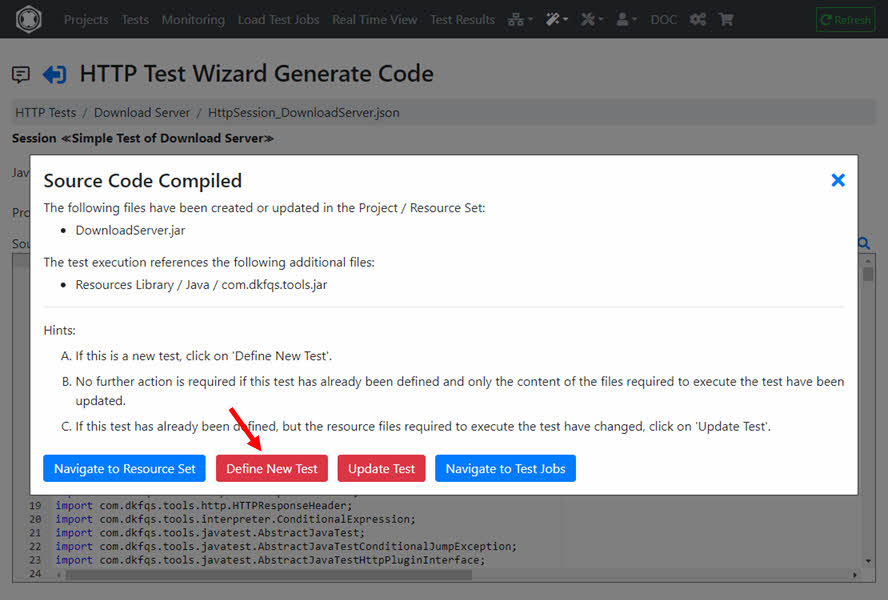
After debugging is successful, return to the HTTP Test Wizard.
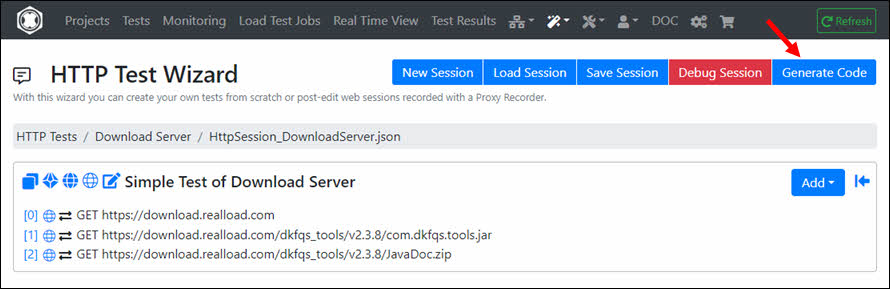
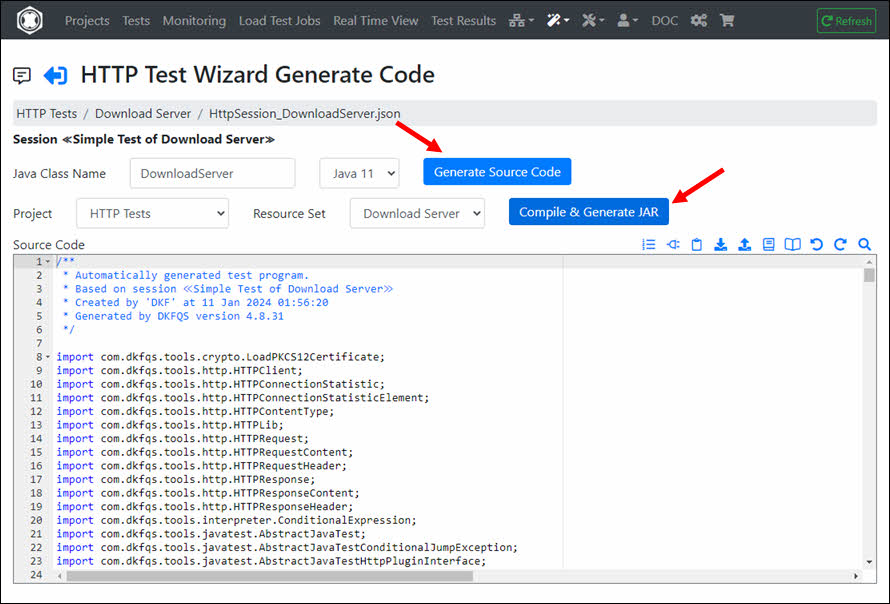
After the source code is compiled, click ‘Define New Test’.
Enter the Test Description, and click ‘Define New Test’.
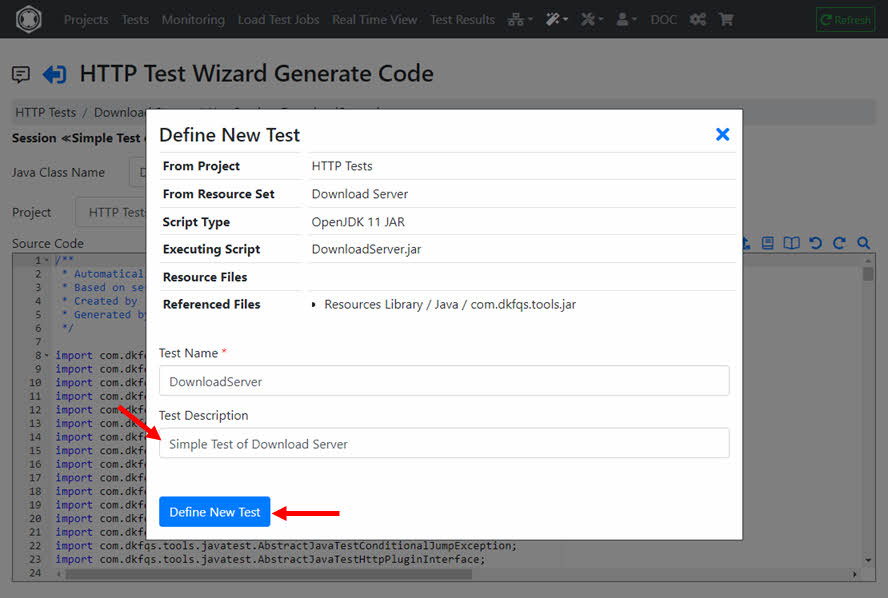
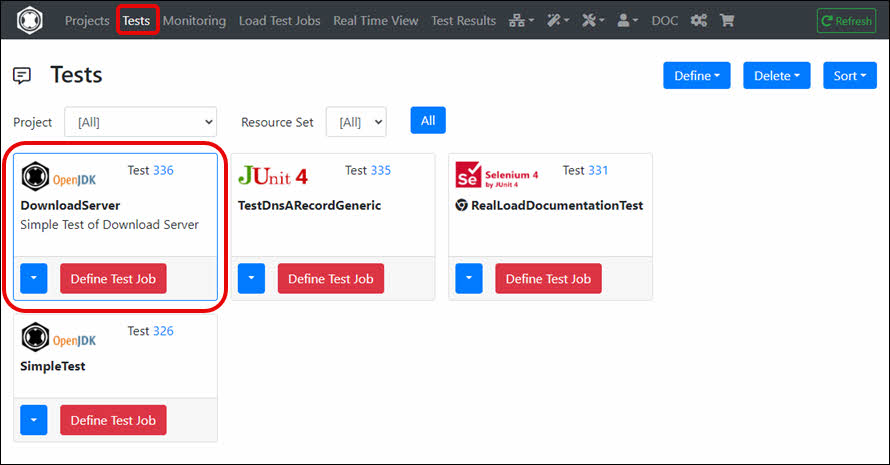
The RealLoad ‘Test’ is now defined. From here you can now create both a Load Test Job and a Monitoring Job.
Note: In case you (later) modify the session in the HTTP Test Wizard, you will have to generate and compile the source code again.
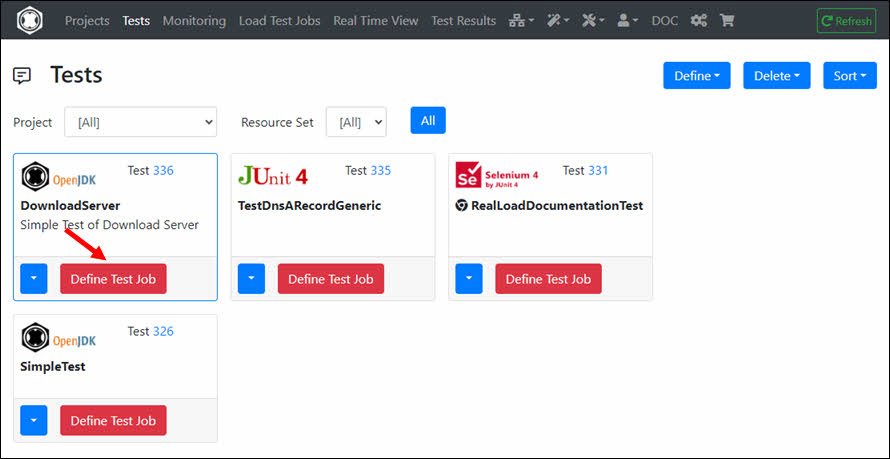
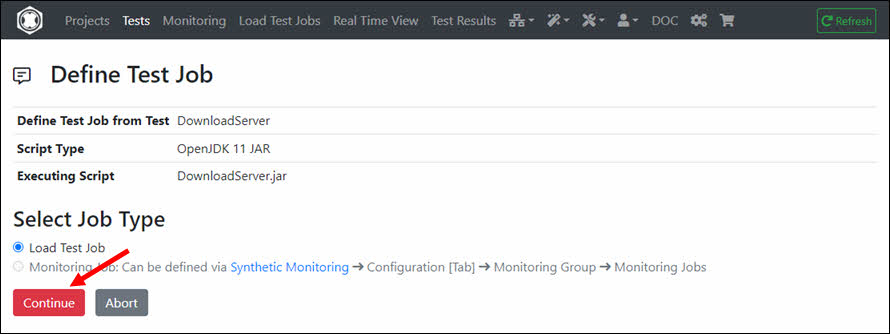
In the RealLoad ‘Test’ click ‘Define Test Job’.
In next menu click ‘Continue’ …
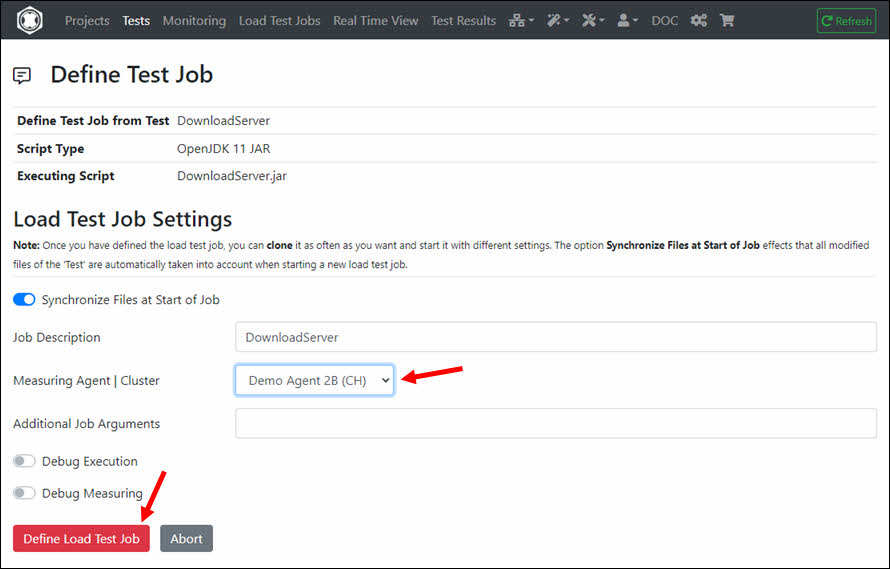
… And select the Measuring Agent on which the Load Test Job will be executed, then click ‘Define Load Test Job’.
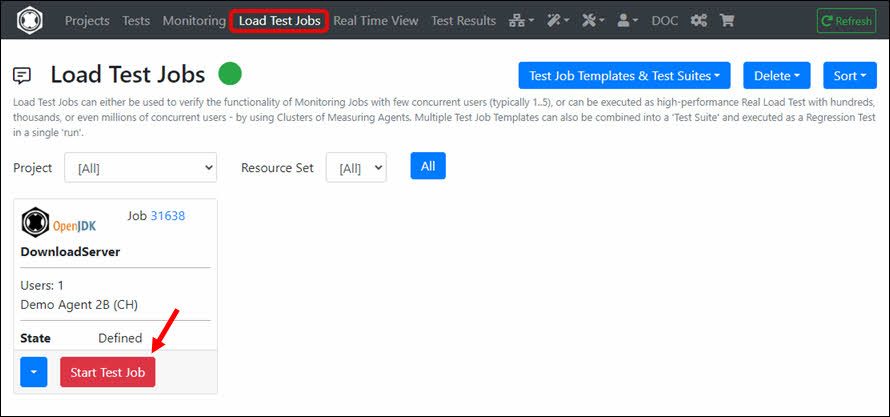
The Load Test Job is now defined. Click ‘Start Test Job’.
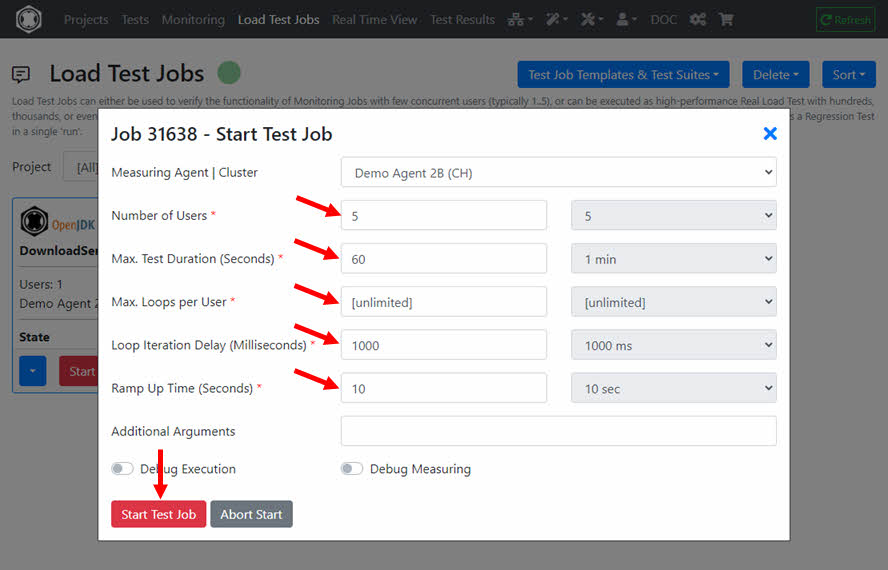
Enter the settings of the Load Test Job here and then click ‘Start Test Job’. We recommend the following settings for the first load test run:
A free account allows you to execute Load Tests with the following limitations ¹ :
¹ = Does not apply for Load Test Jobs executed on Measuring Agents launched by Cloud Credits: in this case there are no such restrictions.
You can add a Real Load license to your account at any time by purchasing it in our shop https://shop.realload.com .
After a few seconds the Load Test Job is in the state ‘Running’. Click ‘Monitor Jobs’.
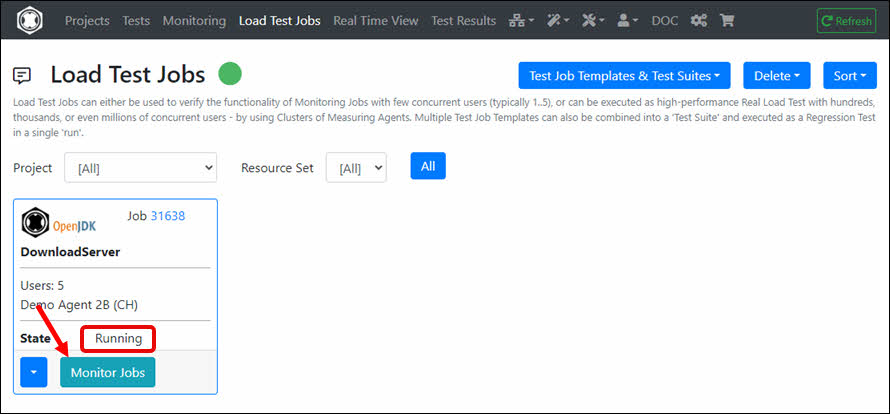
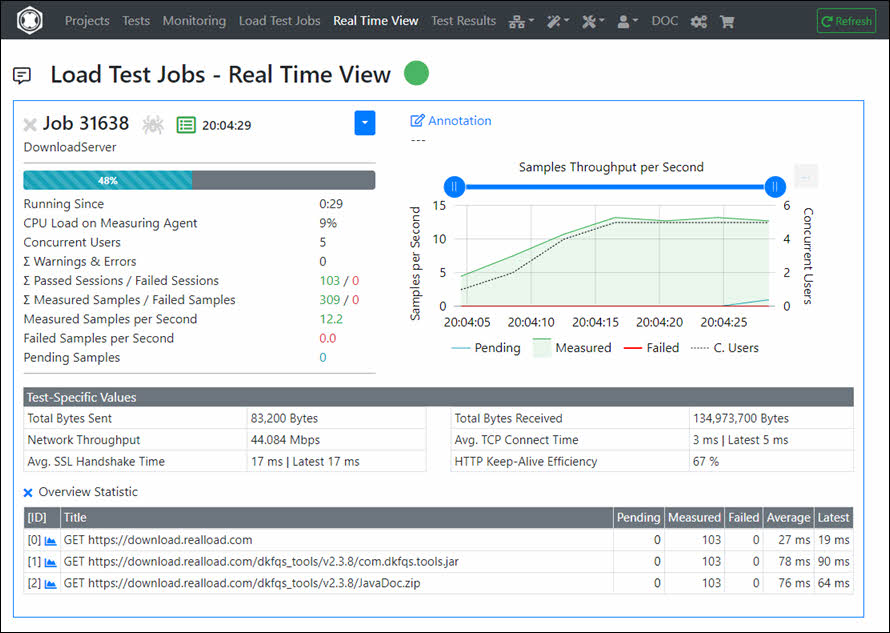
The real-time data of the running Load Test Job is now displayed.
Click on ‘Analyze Result’ after the Load Test Job is completed.
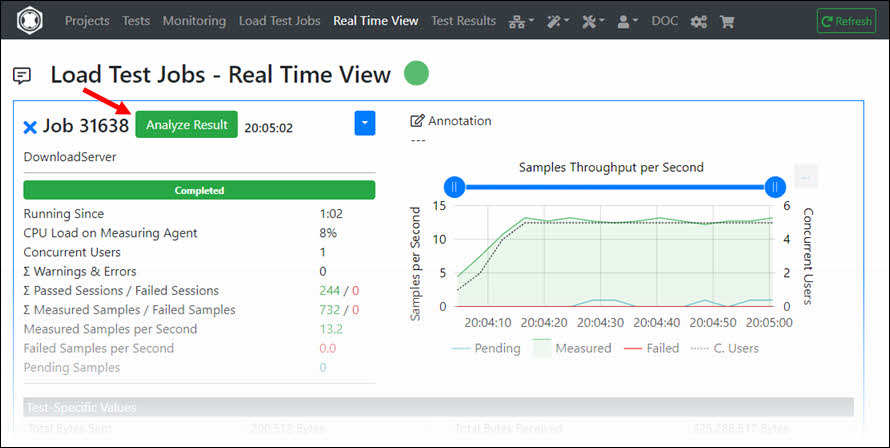
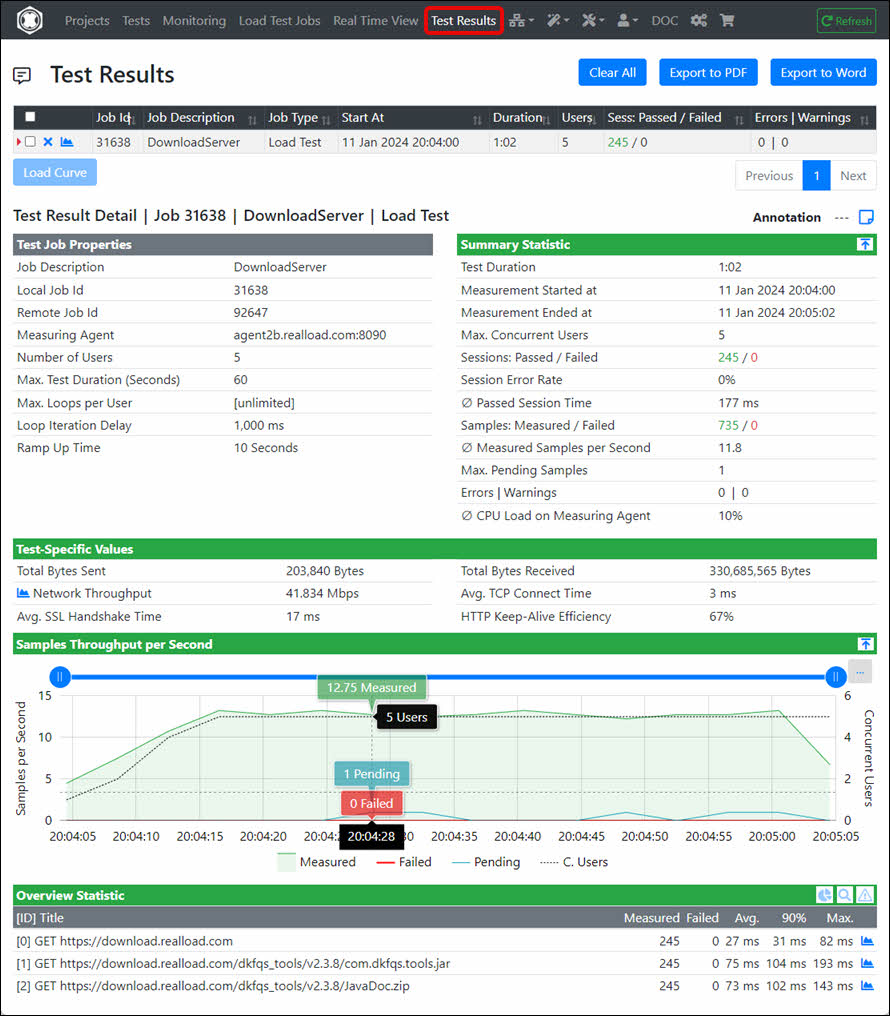
The Load Test Job result is then displayed.
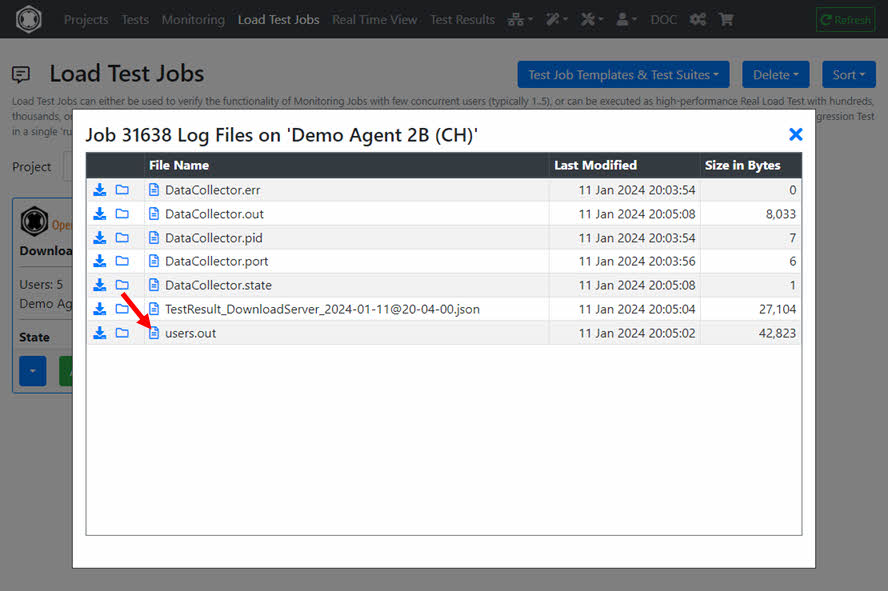
To view the Job Output Files navigate to ‘Load Test Jobs’ and click in the dropdown of the Job on ‘Job Log Files’.
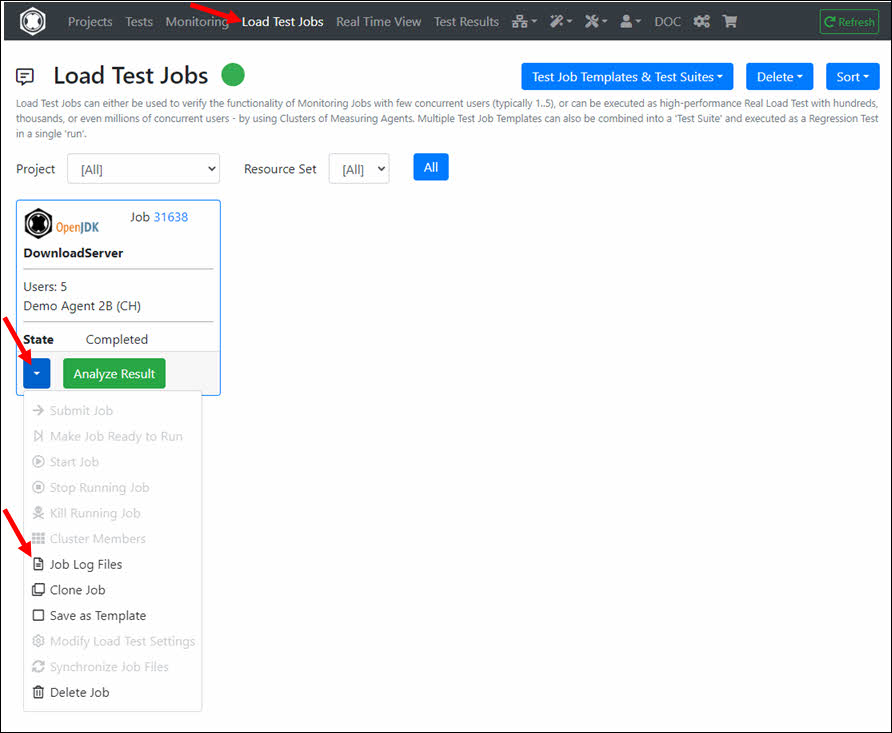
Select the file users.out which contains the Log Output of the Job.
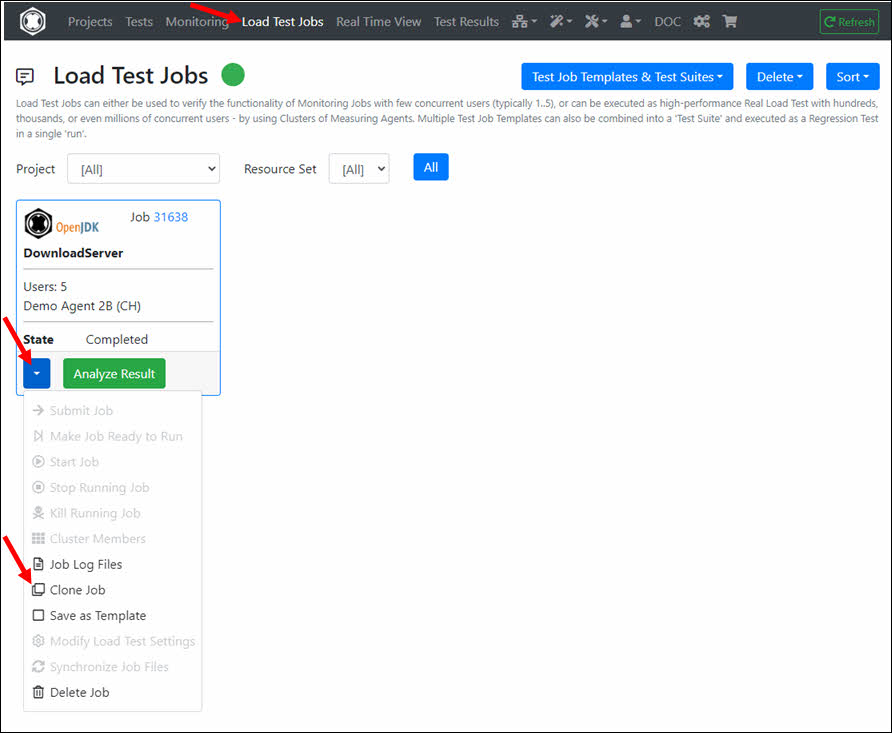
If you would like to run the Load Test Job again with the same or changed settings, click on ‘Clone Job’ in the Job dropdown and then start the cloned job.
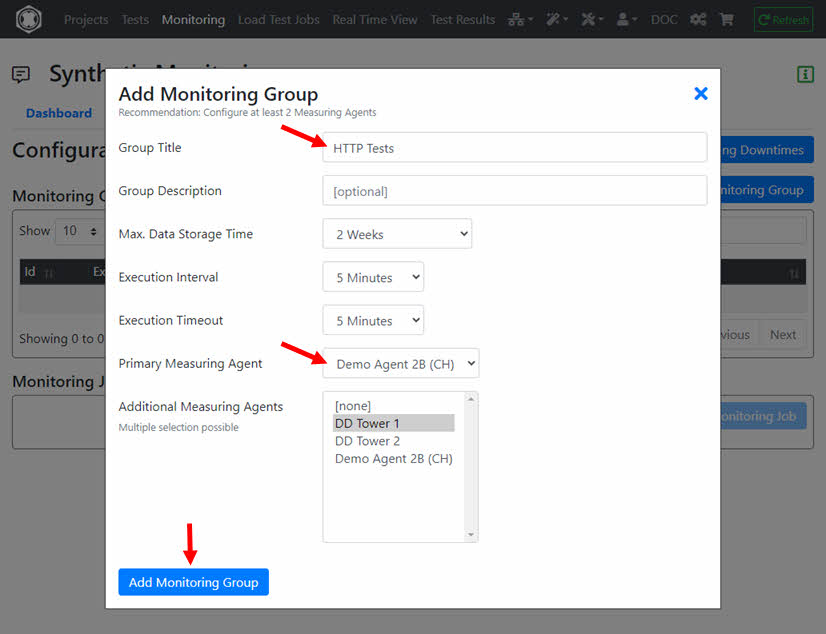
If this is your first Monitoring Job, you must first create a Monitoring Group. Navigate to Monitoring, click the ‘Configuration’ tab and then click ‘Add Monitoring Group’. There is also a help available for configuring the Synthetic Monitoring.
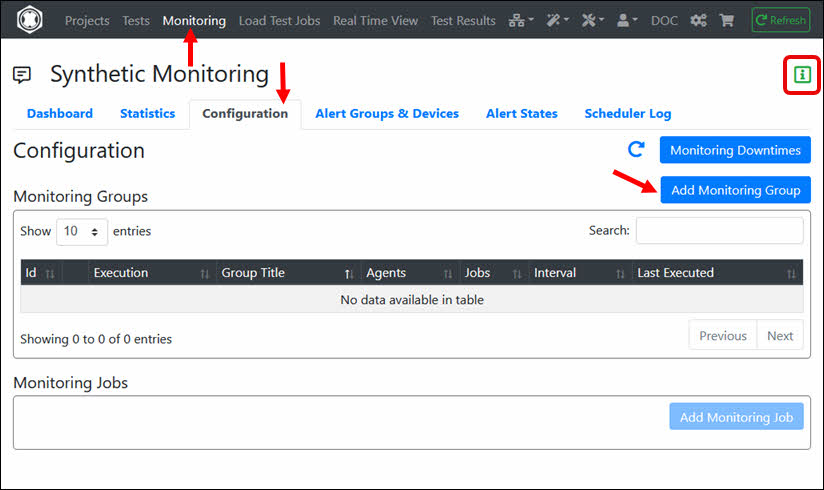
Enter the ‘Group Title’ and select at least one ‘Measuring Agent’ on which the Monitoring Job(s) will be executed. Then click ‘Add Monitoring Group’.
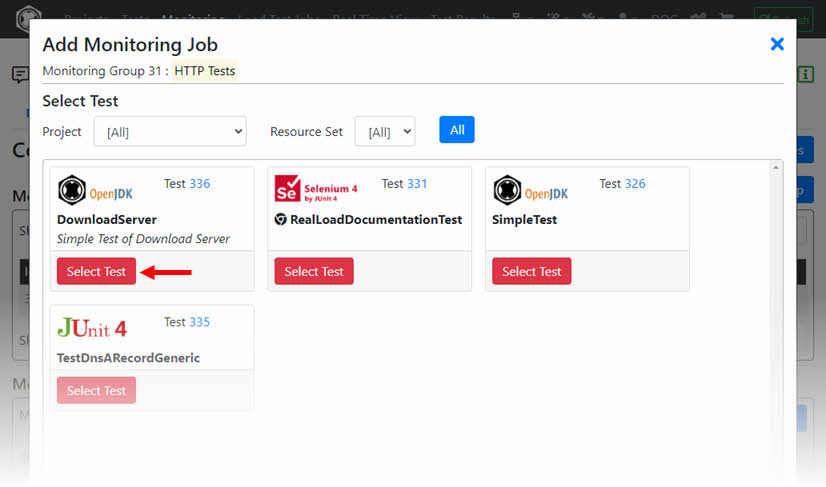
In the ‘Monitoring Group’ click ‘Monitoring Jobs’ and then click ‘Add Monitoring Job’.

Select the ‘Test’ of the Monitoring Job.
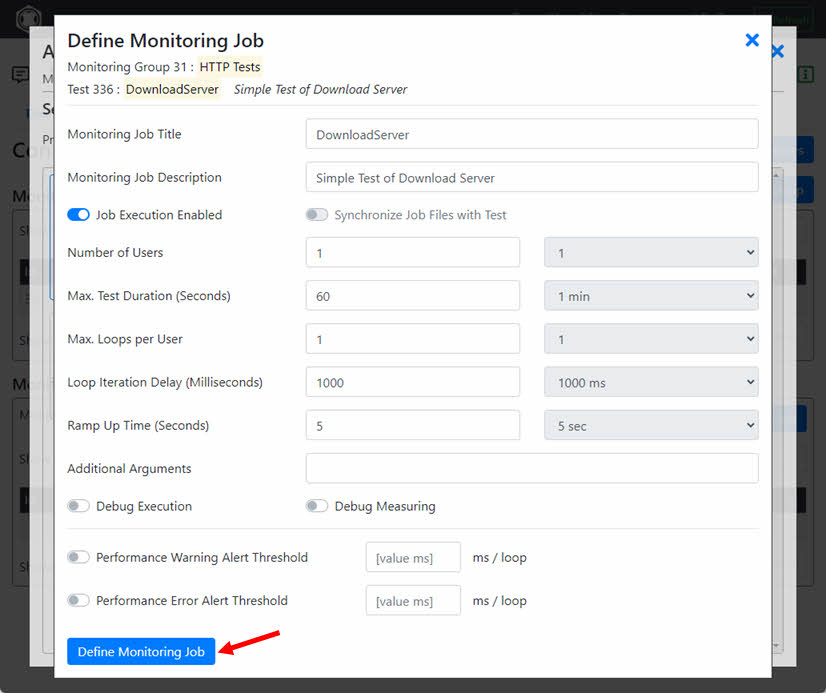
Click ‘Define Monitoring Job’.
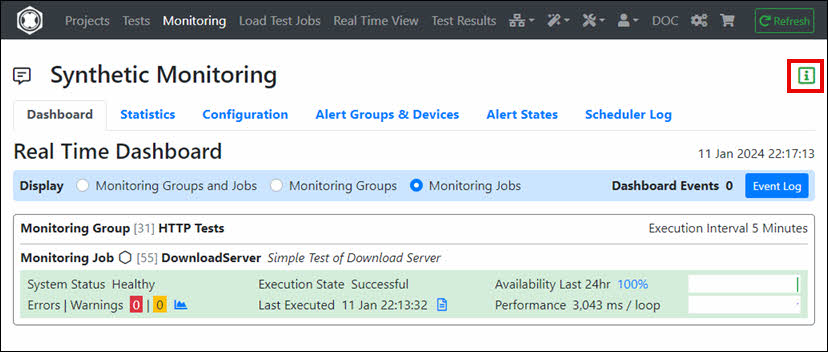
Enable the execution of the Monitoring Group and navigate to ‘Dashboard’.
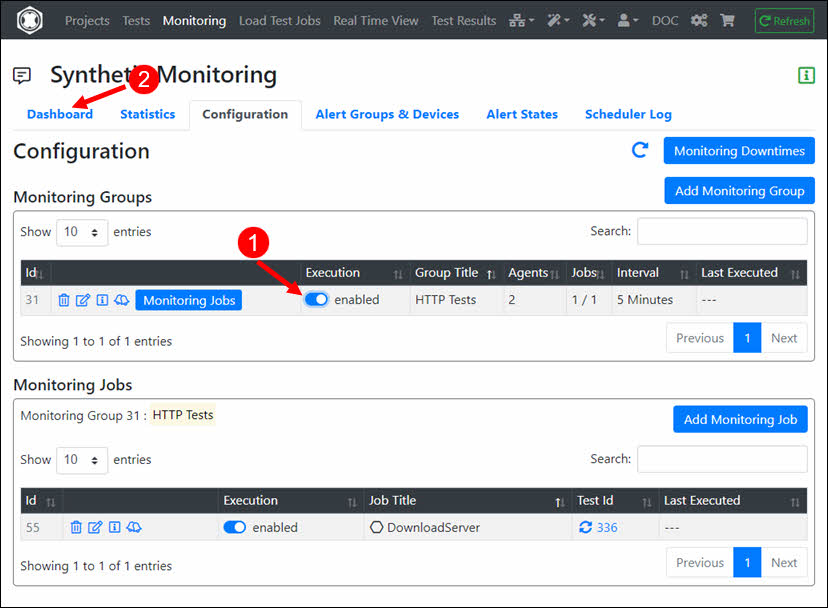
The Monitoring Job is now defined and will be executed periodically. For additional help configuring monitoring (e.g. adding ‘Alert Devices’), see Monitoring Help.
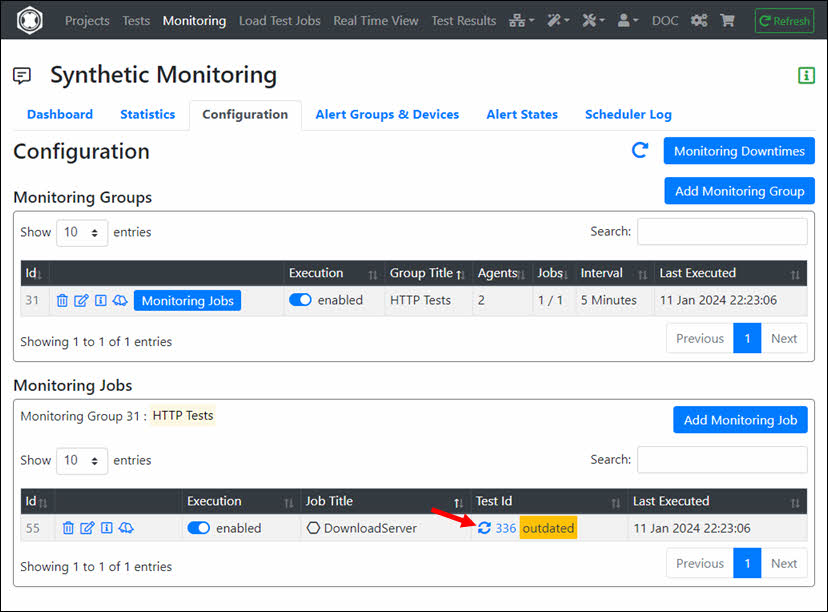
Tip: If you modify the RealLoad ‘Test’, the corresponding Monitoring Job is not automatically updated to avoid unexpected corruption of the Monitoring Job. After you have verified the modified ‘Test’ by running a small Load Test Job, you must manually update the Monitoring Job.
Done, congrats, you’ve run your first test with Real Load.
As you have seen, a RealLoad Test can be run as both a Load Test Job and a Monitoring Job.
This example was deliberately kept simple so that you can become familiar with the RealLoad product. To create a test with a web browser session across multiple web pages, you can use a Remote Proxy Recorder to record the test case and then convert the recording into an HTTP Test Wizard session.
Additionally, a Test Job Template can also be defined from any ‘Load Test Job’, which can then be part of a Test Suite. This means that you can add multiple ‘Test Job Templates’ to a Test Suite and execute them in a single run as a Regression Test.
To learn more, we recommend you read the User Guide. There you will find detailed documentation on the steps described in this document.
This example shows how a Selenium IDE Test - which was recorded with a Chrome or Firefox web browser - can be converted into a RealLoad ‘Test’. The converted RealLoad ‘Test’ can then be executed both as a Load Test Job and as a Monitoring Job. In addition, the converted test can also be part of a Test Suite for performing Regression Tests.
In most cases, the conversion can be done easily with just a few mouse clicks - without the need for any special settings.
At the end of each executed test run (of the converted RealLoad test), a final screenshot of the simulated web browser session is taken for each virtual user so that you can check whether the web browser session of the virtual user has been fully executed.
Tip: If possible, always use the Chrome web browser for Selenium IDE recording, as Chrome sessions are simulated much faster (= more realistic) than Firefox sessions.
To configure and execute this test you’ll need:
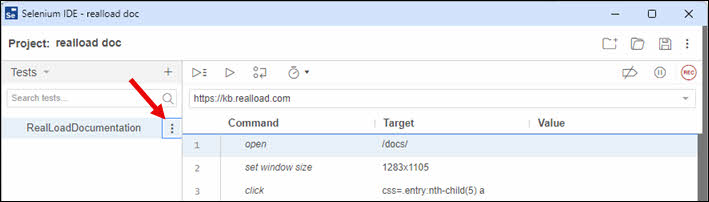
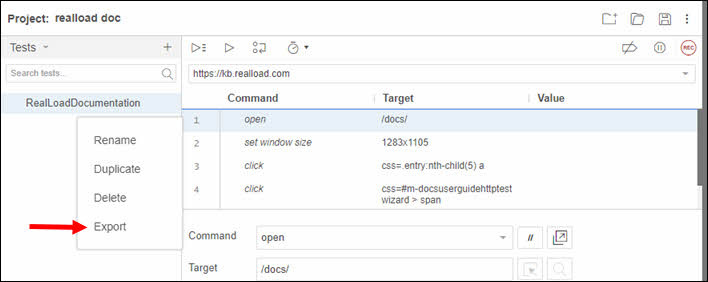
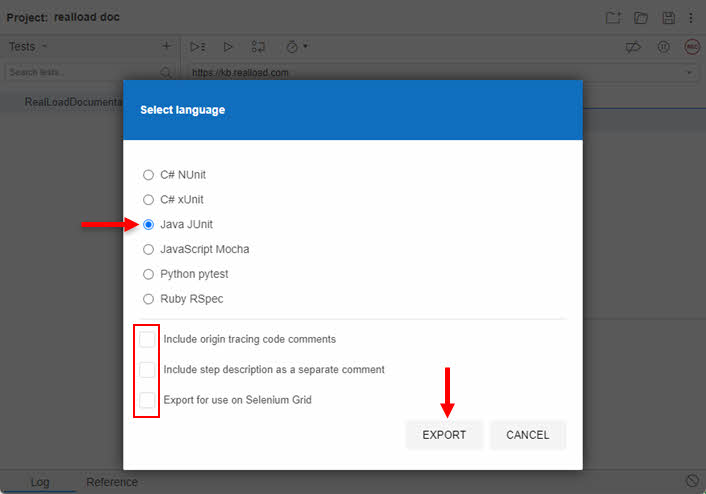
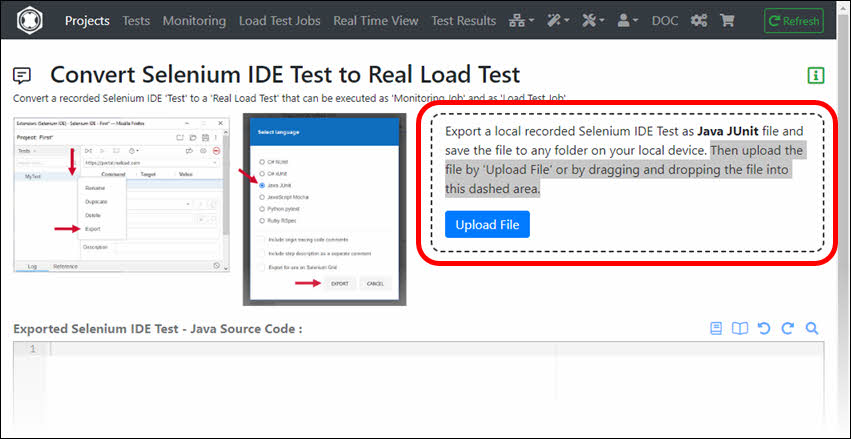
Export the your recorded Selenium IDE Test as Java JUnit file and save the file to any folder on your local device.
Note that the 3-dot dropdown icon may initially be hidden and may only appear when you are near to the Selenium ‘Test Case’ area. Do not choose any export option.
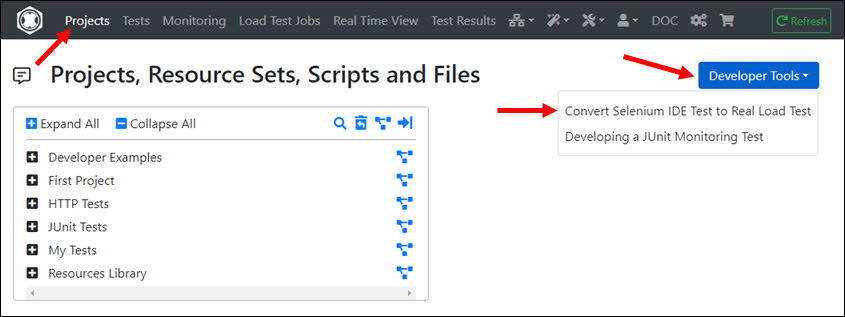
At Projects menu click on the ‘Developer Tools’ dropdown and select ‘Convert Selenium IDE Test to Real Load Test’.
Then upload the file by ‘Upload File’ or by dragging and dropping the file into the dashed area.
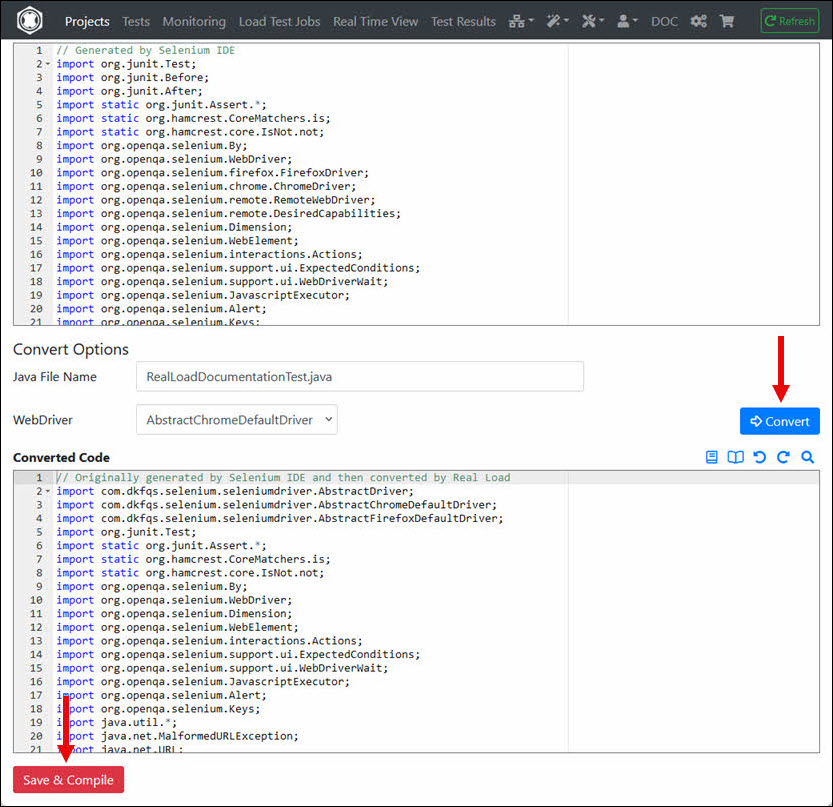
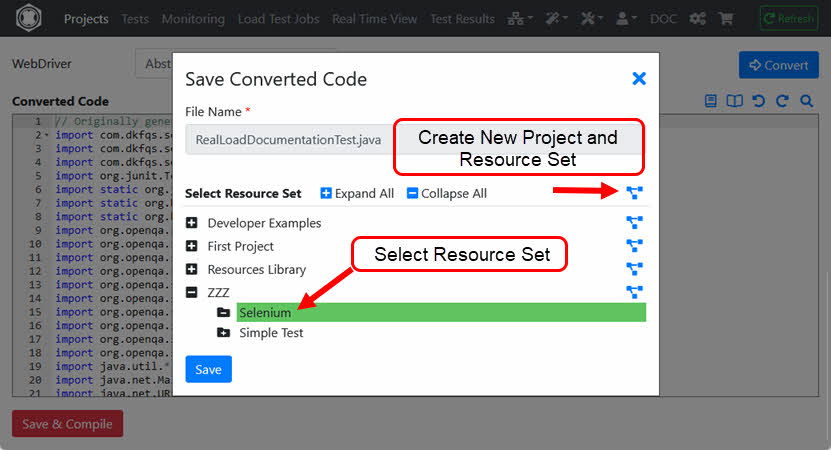
Click on the ‘Convert’ button after uploading the file. The converted Java code is then displayed. Then click on the ‘Save & Compile’ button.
You have to save the converted code in a Resource Set of a Project. You can also first create a new Project with a new Resource Set.
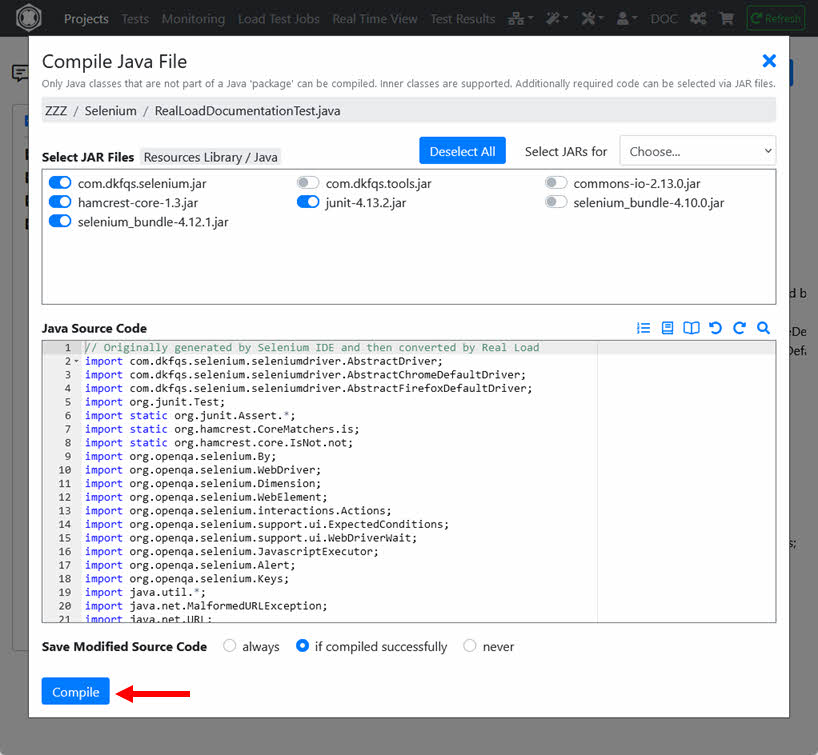
After saving the converted code, you will be automatically redirected to the Compile Java File dialog.
The JAR files required to compile are already preselected, i.e. you need only click the ‘Compile’ button.
After successful compilation, click ‘Define or Update Selenium by JUnit Test’.
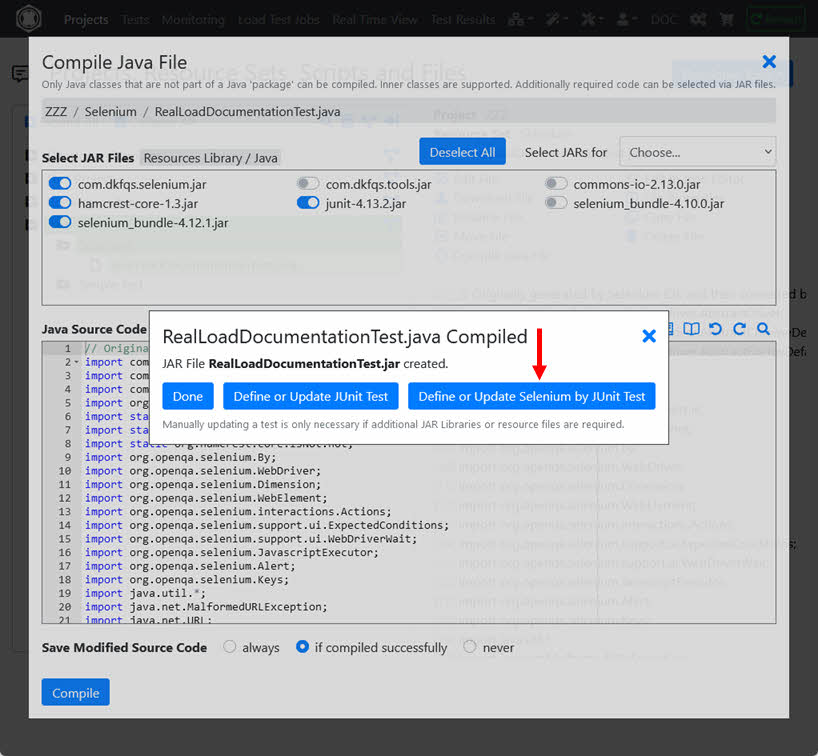
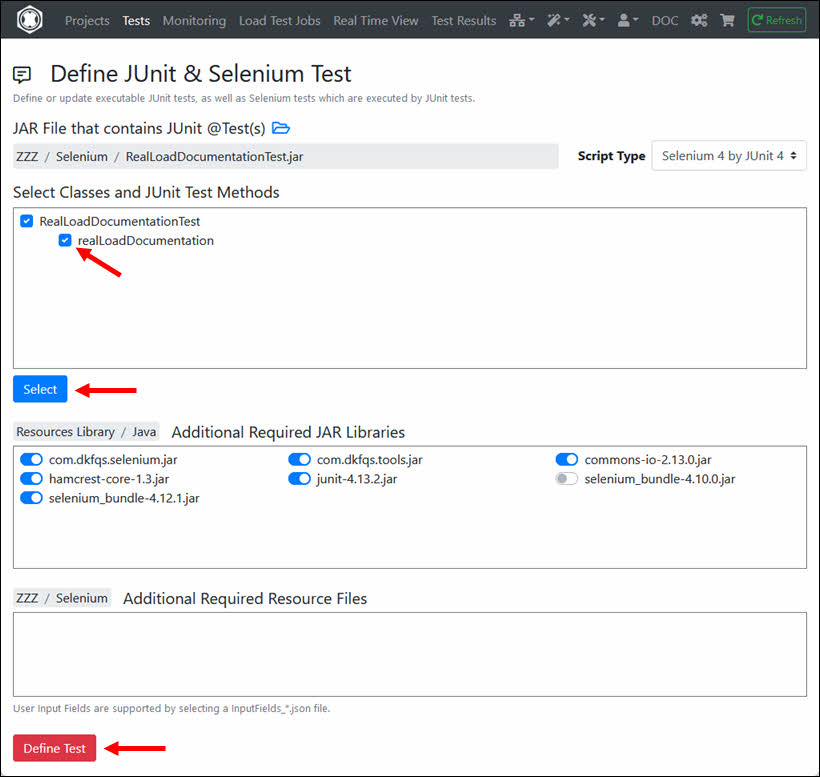
You will then be automatically redirected to the Define JUnit & Selenium Test dialog.
Select the JUnit @Test method (in this case only one will be shown) and click ‘Define Test’.
In an intermediate step you can enter an (optional) test description.
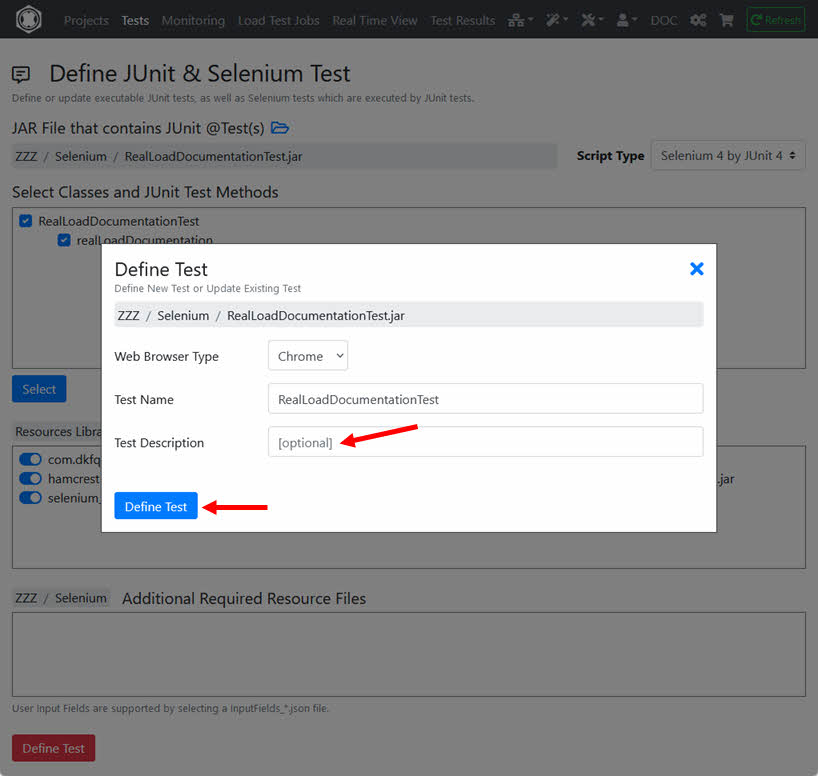
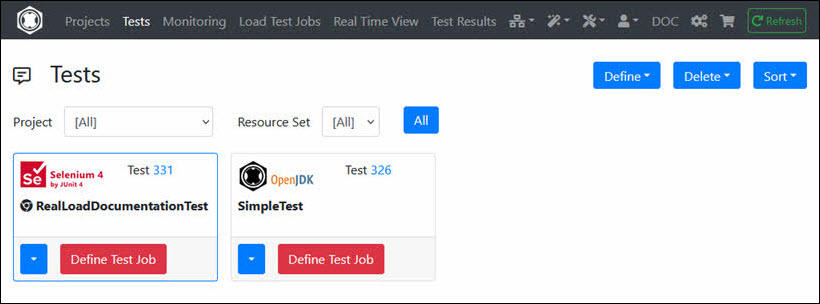
Now the Selenium RealLoad ‘Test’ is defined from which you can define a Load Test Job and/or a Monitoring Job.
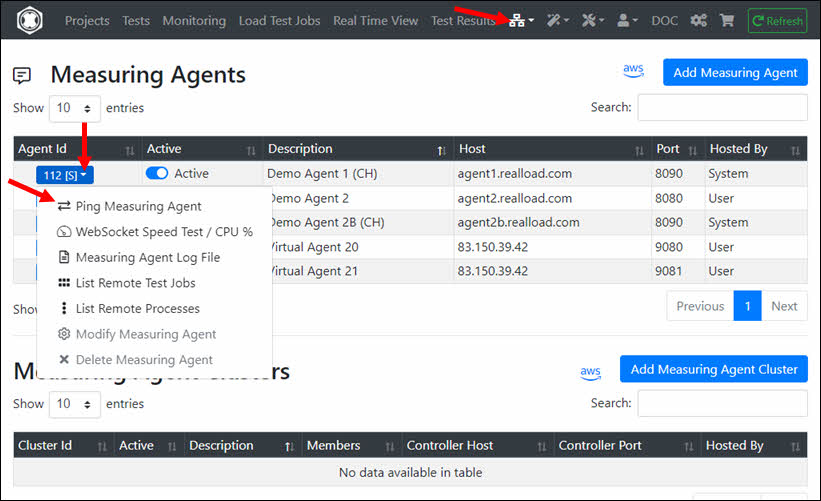
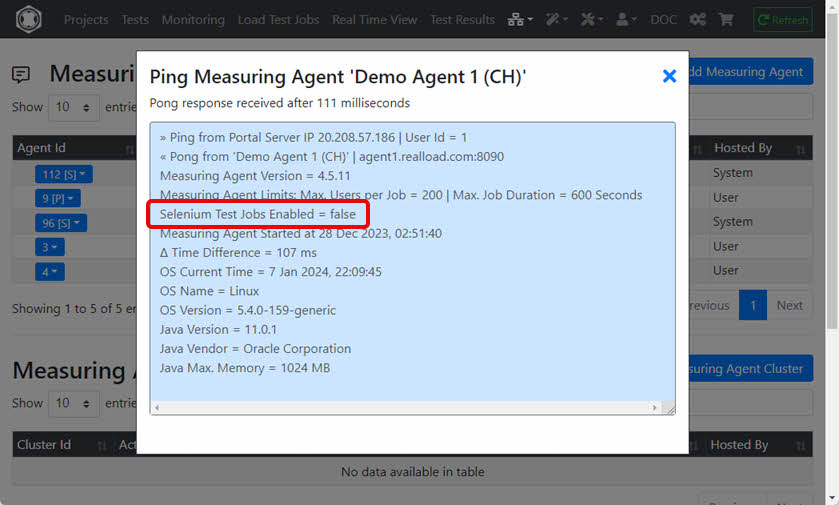
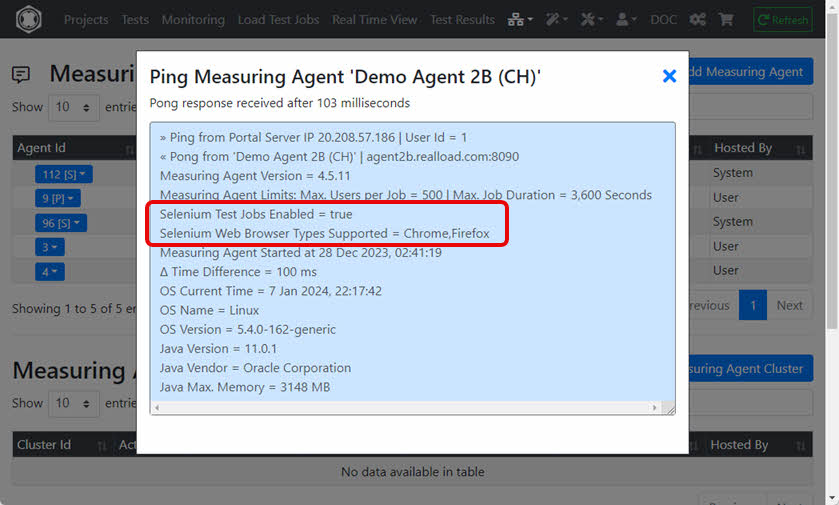
Please note that not all Measuring Agents support the execution of Selenium jobs. You can ‘ping’ a Measuring Agent at application level to find out whether Selenium jobs are supported:
Example 1: Measuring Agent ‘Demo Agent 1 (CH)’ does not support Selenium jobs
Example 2: Measuring Agent ‘Demo Agent 2B (CH)’ supports Selenium jobs
With this new release we have reached the point where a general load testing tool has been crossed with a monitoring tool and also with a regression testing tool - with both the monitoring tool and the regression testing tool are capable of executing test jobs with hundreds or thousands of concurrent users.
In order to enable the automatic Java memory configuration of a Measuring Agent 4.1.0, the following Java program arguments must be set in the startup script: -autoAdjustMemory -osReservedMemory 1GB
Furthermore, the Java memory of the Measuring Agent should be set in the startup script as shown in the table below:
| OS Physical Memory | Measuring Agent Java -Xmx setting |
|---|---|
| <2 GiB | 256m |
| 2..3 GiB | 512m |
| 4..7 GiB | 512m |
| 8..15 GiB | 1536m |
| 16..31 GiB | 3072m |
| 32..63 GiB | 4096m |
| 64..96 GiB | 6144m |
| >96 GiB | 8192m |
| Odd number of GiB should be rounded up (e.g. 7.7 = 8 = 1536m). |
Example: sudo -H -u dkfqs bash -c ‘CLASSPATH=/home/dkfqs/agent/bin/bcpkix-jdk15on-160.jar:/home/dkfqs/agent/bin/bcprov-jdk15on-160.jar:/home/dkfqs/agent/bin/bctls-jdk15on-160.jar:/home/dkfqs/agent/bin/DKFQSMeasuringAgent.jar;export CLASSPATH;nohup java -Xmx512m -DdkfqsMeasuringAgentProperties=/home/dkfqs/agent/config/measuringagent.properties -Dnashorn.args="–no-deprecation-warning" com.dkfqs.measuringagent.internal.StartDKFQSMeasuringAgent -autoAdjustMemory -osReservedMemory 1GB 1>/home/dkfqs/agent/log/MeasuringAgent.log 2>&1 &’
Advantages and disadvantages of ‘Cloud Credits’ versus launching AWS/EC2 instances by the ‘Desktop Companion’:
Benefits of ‘Cloud Credits’:
Advantages of the ‘Desktop Companion’:
Portal Server Installation / Ubuntu 20: The “fontconfig” package has to be installed in order that the captcha generator is working:
sudo apt-get update
sudo apt-get install fontconfig
in /etc/security/limits.conf add or modify:
# TCP/IP Tuning
# =============
* soft     nproc          262140
* hard     nproc          262140
* soft     nofile         262140
* hard     nofile         262140
root soft     nproc          262140
root hard     nproc          262140
root soft     nofile         262140
root hard     nofile         262140
Enter: systemctl show -p TasksMax user-0
output: TasksMax=8966
if you get a value less than 262140 then add in /etc/systemd/system.conf
# System Tuning
# =============
DefaultTasksMax=262140
Reboot the system and verify the settings. Enter: ulimit -n
output: 262140
Enter: systemctl show -p TasksMax user-0
output: TasksMax=262140
Synthetic Monitoring is an essential part of Digital Experience Monitoring, where organizations can detect their service outages or performance degrade proactively by periodically running the tests.
RealLoad provides an easy way of configuring synthetic tests with an outcome of accurate metrics, alerting and SLA details.
RealLoad Synthetic Monitoring Features
You have first to define a RealLoad ‘Test’ before you can add it to Synthetic Monitoring.
First add a Monitoring Group and then add one or more Monitoring Jobs to the Monitoring Group. If you want to run Monitoring Jobs with different intervals, you can also define several Monitoring Groups. Measuring Agents will be available for selection based on how many agents are already configured on different geographical locations.


Input Fields:
After you have added a monitoring group, its execution is switched off. Switch on the execution now:

In a Monitoring Group, first click on ‘Monitoring Jobs’ and then in the Monitoring Jobs area on ‘Add Monitoring Job’:

Then select a Test …

… And Configure and Define the Monitoring Job:

Input Fields:
Normally you do not have to enter any “Additional Arguments” and leave “Debug Execution” and “Debug Measuring” switched off.
Tip: We recommend that you leave options ‘Performance Warning Alert Threshold’ and ‘Performance Error Alert Threshold’ switched off for now and configure them later - after the new defined Monitoring Job has been running for a few hours.
The following limits apply for Monitoring Jobs which are executed on shared Measuring Agents:
If you operate your own, private Measurement Agents (or have us to operate them), these limits do not apply - meaning you can run Monitoring Jobs with hundreds or thousands of concurrent users.
Proceed as follows:
First click on the ‘Alert Groups & Devices’ tab and then click on ‘Add Alert Group’.


Input Fields:
Tip: For example, you can define two alert groups, one for operations and another for developers. In the developer alert group, you could turn off the switches ‘Report System Failures’ and ‘Report Execution Failures’.
First expand the area of the alert device type and then click the ‘+’ icon:


After adding the alert device, you should test it:


After an Alert Device has been added, you can assign it to one or more Alert Groups.


To receive Alert Notifications, you must assign the Alert Groups to Monitoring Groups and/or to Monitoring Jobs.

If you click on a bell icon you can only assign one Alert Group. However, you can click the icon multiple times to assign multiple Alert Groups.
Now the created monitoring groups with its monitoring jobs will be available under the Real-Time Dashboard like below with the important metrics and also have the option to drill down into test results

Custom dashboards can be created on third party products like Grafana, using our WebSocket API


Next explains about the statistics data, which will be the source for many KPIs , for example to calculate the defined SLA for an application or an API service

The portal server has three APIs:
All APIs require so-called “Authentication Tokens” to verify the access authorization. If 5 or more invalid “Authentication Tokens” are sent within 60 seconds, the corresponding remote IP address is blocked for 30 minutes.
To perform a Remote Admin API call, you must first generate an “Admin API Auth Token” in the Administrator Menu of the portal. When generating the token you can enter a purpose (only used as information) and also restrict the remote IP addresses for which the token is valid. You can also specify whether the token has read/write access or read/only access.

The API supports the following functions (so-called “actions”):
| URL | HTTP Method |
|---|---|
| https://portal.realload.com/RemoteAdminAPI | POST |
| All data are sent and received in JSON data format. The “authTokenValue” and the “action” must always be sent when an API call is made. |
curl -v --request POST --header "Content-Type: application/json" --data "@getAllUserAccounts.json" https://portal.realload.com/RemoteAdminAPI
{
  "authTokenValue": "8mKSz1UzaQg17kfu",
  "action": "getAllUserAccounts"
}
{"allUserAccountsArray":
[{"userId":13,"nickname":"DKF","firstName":"Max","lastName":"Fischer","primaryEmail":"max@dkfqa.com","primarySMSPhone":"+41771111111","secondaryEmail":"","secondarySMSPhone":"","accountBlocked":false,"accountCreateTime":1538556183756,"lastLoginTime":1625181623869,"lastLoginIP":"127.0.0.1","pricePlanId":1,"accountExpiresTime":-1,"pricePlanTitle":"Unlimited"},{"userId":18,"nickname":"AX","firstName":"Alex","lastName":"Fischer","primaryEmail":"alexfischer66@yahoo.com","primarySMSPhone":"+41781111111","secondaryEmail":"","secondarySMSPhone":"","accountBlocked":false,"accountCreateTime":1539874749677,"lastLoginTime":1616111301975,"lastLoginIP":"127.0.0.1","pricePlanId":1,"accountExpiresTime":-1,"pricePlanTitle":"Unlimited"},{"userId":22,"nickname":"Kes","firstName":"Kesorn","lastName":"Fischer","primaryEmail":"gsklsta@yahoo.com","primarySMSPhone":"+66000000000","secondaryEmail":"","secondarySMSPhone":"","accountBlocked":false,"accountCreateTime":1605303204754,"lastLoginTime":1624389324770,"lastLoginIP":"127.0.0.1","pricePlanId":6,"accountExpiresTime":-1,"pricePlanTitle":"BASIC1"},{"userId":48,"nickname":"BET","firstName":"Bettina","lastName":"Meier","primaryEmail":"b123456@lucini.id.au","primarySMSPhone":"+61404905702","secondaryEmail":"","secondarySMSPhone":"","accountBlocked":false,"accountCreateTime":1623719604561,"lastLoginTime":-1,"lastLoginIP":"","pricePlanId":6,"accountExpiresTime":1625061600000,"pricePlanTitle":"BASIC1"}],
"isError":false}
If the API call is successful, then the response field “isError” is false. If a numeric field has a value of -1 (minus one), this means “no data” or “unlimited” depending on the context.
Specific Request Fields:
Specific Error Flags:
Specific Request Fields:
Specific Error Flags:
Specific Request Fields:
The license is successfully assigned to a user if either mapToUserEmailAddress or mapToUserMobilePhone matches to a user account.
Specific Error Flags:
JSON Request Example:
{
  "authTokenValue":"8mKSz1UzaQg17kfu",
  "action":"addLicenseCertificateToUser",
  "licenseProvider": "Real Load Pty Ltd / nopCommerce",
  "mapToUserEmailAddress": "max@dkfqa.com",
  "mapToUserMobilePhone": "+41771111111",
  "licenseCertificate": "-----BEGIN CERTIFICATE-----\r\nMIIEnjCCA4agAwIBAgIEyDnukzANBgkqhkiG9w0BA ...... Hn/UMGAGRB6xF4w+TewYqTAZrdhi/WLyYwg==\r\n-----END CERTIFICATE-----"
}
JSON Response Example (Success Case):
{"licenseId":12,"cloudCreditLicenseId":-1,"userId":13,"isCloudCreditsLicense":false,"isError":false}
JSON Response Example (Error Case):
{"isError":true,"genericErrorText":"","writeAccessError":false,"licenseProviderError":false,"mapToUserError":false,"pricePlanError":false,"licenseCertificateAlreadyAddedError":false,"licenseCertificateError":true}
Specific Request Fields:
Specific Error Flags:
JSON Response Example:
{
  "isServerMaintenanceMode":false,
  "isSignInSelectPricePlanFromMultipleValidLicenseCertificates":true,
  "isSignInExpiredAccountCanEnterLicenseCertificate":true,
  "isSignUpEnabled":true,
  "isSignUpRequiresInvitationTicket":false,
  "signUpDefaultPricePlanId":2,
  "signUpDefaultAccountExpiresInDays":14,
  "deleteExpiredUserAccountsAfterDays":183,
  "isError":false
}
Specific Request Fields:
Specific Error Flags:
JSON Request Example:
{
  "authTokenValue":"8mKSz1UzaQg17kfu",
  "action":"setServerMaintenanceMode",
  "serverMaintenanceMode":true
}
JSON Response Example (Success Case):
{"isServerMaintenanceMode":true,"isError":false}
To perform a Remote User API call, you must first sign in into the portal and generate an “API Authentication Token”. When generating the token you can enter a purpose (only used as information) and also restrict the remote IP addresses for which the token is valid.


The API supports the following functions (so-called “actions”):
Common Functions:
Projects, Resource Sets and Files Functions:
Measuring Agents Functions:
Measuring Agent Cluster Functions:
HTTP/S Remote Proxy Recorders Functions:
Load Test Jobs Functions:
Test Execution Suites Functions:
| URL | HTTP Method |
|---|---|
| https://portal.realload.com/RemoteUserAPI | POST |
| All data are sent and received in JSON data format. The “authTokenValue” and the “action” must always be sent when an API call is made. |
curl -v --request POST --header "Content-Type: application/json" --data {\"authTokenValue\":\"jPmFClqeDUXaEk8Q274q\",\"action\":\"getUserAccountInfo\"} https://portal.realload.com/RemoteUserAPI
{
  "authTokenValue": "jPmFClqeDUXaEk8Q274q",
  "action": "getUserAccountInfo"
}
{
  "userAccountInfo":{
    "userId":48,
    "nickname":"BET",
    "firstName":"Bettina",
    "lastName":"MeierHans",
    "primaryEmail":"bettina@meierhans.id.au",
    "primarySMSPhone":"+61401111111",
    "secondaryEmail":"",
    "secondarySMSPhone":"",
    "accountBlocked":false,
    "accountCreateTime":1623719604561,
    "lastLoginTime":1625348376450,
    "lastLoginIP":"127.0.0.1",
    "pricePlanId":6,
    "accountExpiresTime":1625953109397,
    "pricePlanTitle":"BASIC1"
    },
  "isError":false
}
If the API call is successful, then the response field “isError” is false. If a numeric field has a value of -1 (minus one), this means “no data” or “unlimited” depending on the context.
Specific Request Fields:
Specific Error Flags:
Specific Request Fields:
Specific Error Flags:
JSON Response Example:
{
  "pricePlanInfo":{
    "pricePlanId":6,
    "title":"BASIC1",
    "description":"",
    "isDeprecated":false,
    "lastModified":1625348413042,
    "maxDiskSpaceMB":1024,
    "maxSubUserAccounts":0,
    "maxMeasuringAgentsOwnedByUser":3,
    "maxRemoteProxyRecordersOwnedByUser":3,
    "executeLoadJobsEnabled":true,
    "executeMonitoringJobsEnabled":false,
    "apiAccessEnabled":true,
    "maxStartLoadJobsLast24h":24,
    "maxUsersPerLoadJob":500,
    "maxDurationPerLoadJob":1800
  },
  "isError":false
}
The unit for “maxDurationPerLoadJob” is seconds.
Specific Request Fields:
Specific Error Flags:
JSON Response Example:
{
  "projectsArray": [
    {
      "projectId": 97,
      "projectName": "Common",
      "projectDescription": "",
      "resourceSetsArray": [
        {
          "resourceSetId": 154,
          "resourceSetName": "Input Files",
          "resourceSetDescription": "",
          "filesArray": [
            {
              "fileName": "InputFile.txt",
              "fileSize": 233,
              "fileHashCode": 1873256029,
              "fileLastModified": 1613835992073
            }
          ]
        },
        {
          "resourceSetId": 155,
          "resourceSetName": "Jar Files",
          "resourceSetDescription": "",
          "filesArray": [
            {
              "fileName": "com.dkfqs.tools.jar",
              "fileSize": 578087,
              "fileHashCode": -2033420926,
              "fileLastModified": 1613838181727
            }
          ]
        },
        {
          "resourceSetId": 156,
          "resourceSetName": "Plug-Ins",
          "resourceSetDescription": "",
          "filesArray": [
            {
              "fileName": "HttpSessionPlugin_ChangeCopyright.json",
              "fileSize": 5321,
              "fileHashCode": 1958407366,
              "fileLastModified": 1613838287871
            }
          ]
        }
      ]
    },
...
...
...
  ],
  "isError": false
}
Specific Request Fields:
Response Fields:
Specific Error Flags:
JSON Request Example:
{
  "authTokenValue":"jPmFClqeDUXaEk8Q274q",
  "action":"createProject",
  "projectName":"My New Project",
  "projectDescription": "Created by API call"
}
JSON Response Example (Success Case):
{"projectId":113,"isError":false}
JSON Response Example (Error Case):
{"isError":true,"genericErrorText":"","diskSpaceLimitExceededError":false,"projectNameError":true}
Specific Request Fields:
Specific Error Flags:
JSON Request Example:
{
  "authTokenValue":"jPmFClqeDUXaEk8Q274q",
  "action":"deleteProject",
  "projectId":113,
  "moveToTrash":false
}
Specific Request Fields:
Specific Error Flags:
JSON Request Example:
{
  "authTokenValue":"jPmFClqeDUXaEk8Q274q",
  "action":"getResourceSetsOfProject",
  "projectId":97
}
JSON Response Example (Success Case):
{
  "resourceSetsArray": [
    {
      "resourceSetId": 154,
      "resourceSetName": "Input Files",
      "resourceSetDescription": "",
      "filesArray": [
        {
          "fileName": "InputFile.txt",
          "fileSize": 233,
          "fileHashCode": 1873256029,
          "fileLastModified": 1613835992073
        }
      ]
    },
    {
      "resourceSetId": 155,
      "resourceSetName": "Jar Files",
      "resourceSetDescription": "",
      "filesArray": [
        {
          "fileName": "com.dkfqs.tools.jar",
          "fileSize": 578087,
          "fileHashCode": -2033420926,
          "fileLastModified": 1613838181727
        }
      ]
    },
    {
      "resourceSetId": 156,
      "resourceSetName": "Plug-Ins",
      "resourceSetDescription": "",
      "filesArray": [
        {
          "fileName": "HttpSessionPlugin_ChangeCopyright.json",
          "fileSize": 5321,
          "fileHashCode": 1958407366,
          "fileLastModified": 1613838287871
        }
      ]
    }
  ],
  "isError": false
}
Specific Request Fields:
Response Fields:
Specific Error Flags:
JSON Request Example:
{
  "authTokenValue":"jPmFClqeDUXaEk8Q274q",
  "action":"createResourceSet",
  "projectId":97,
  "resourceSetName":"My New Resource Set",
  "resourceSetDescription": "Created by API call"
}
JSON Response Example (Success Case):
{"resourceSetId":172,"isError":false}
JSON Response Example (Error Case):
{"isError":true,"genericErrorText":"","resourceSetNameError":true,"projectIdError":false,"diskSpaceLimitExceededError":false}
Specific Request Fields:
Specific Error Flags:
JSON Request Example:
{
  "authTokenValue":"jPmFClqeDUXaEk8Q274q",
  "action":"deleteResourceSet",
  "projectId":97,
  "resourceSetId":172,
  "moveToTrash":false
}
Specific Request Fields:
Specific Error Flags:
JSON Request Example:
{
  "authTokenValue":"jPmFClqeDUXaEk8Q274q",
  "action":"getFilesInfoOfResourceSet",
  "projectId":23,
  "resourceSetId":143
}
JSON Response Example:
{
  "filesArray": [
    {
      "fileName": "DKFQSLibrary2.psm1",
      "fileSize": 16339,
      "fileHashCode": -1503445747,
      "fileLastModified": 1603566144851
    },
    {
      "fileName": "powershell-http-bern2.ps1",
      "fileSize": 12900,
      "fileHashCode": -1174212096,
      "fileLastModified": 1603566162094
    },
    {
      "fileName": "TestResult_powershell-http-bern2Neu_2020-10-24@21-06-04.json",
      "fileSize": 14395,
      "fileHashCode": -951574615,
      "fileLastModified": 1603566379097
    },
    {
      "fileName": "TestResult_powershell-http-bern2Neu_2020-10-24@21-09-45.json",
      "fileSize": 55128,
      "fileHashCode": 1499924815,
      "fileLastModified": 1603566591322
    }
  ],
  "isError": false
}
Specific Request Fields:
Response Fields:
Specific Error Flags:
JSON Request Example:
{
  "authTokenValue":"jPmFClqeDUXaEk8Q274q",
  "action":"createFile",
  "projectId":23,
  "resourceSetId":143,
  "fileName":"test.txt",
  "fileContentB64":"VGhpcyBpcyB0aGUgY29udGVudCBvZiB0aGUgZmlsZS4="
}
JSON Response Example (Success Case):
{
  "fileName":"test.txt",
  "fileSize":32,
  "fileHashCode":-1460278014,
  "fileLastModified":1625423562384,
  "isError":false
}
JSON Response Example (Error Case):
{"isError":true,"genericErrorText":"","projectIdError":false,"resourceSetIdError":false,"diskSpaceLimitExceededError":false,"fileNameError":true}
Specific Request Fields:
Response Fields:
Specific Error Flags:
JSON Request Example:
{
  "authTokenValue":"jPmFClqeDUXaEk8Q274q",
  "action":"getFile",
  "projectId":23,
  "resourceSetId":143,
  "fileName":"test.txt"
}
JSON Response Example (Success Case):
{
  "fileName":"test.txt",
  "fileContentB64":"VGhpcyBpcyB0aGUgY29udGVudCBvZiB0aGUgZmlsZS4=",
  "fileSize":32,
  "fileHashCode":-1460278014,
  "fileLastModified":1625423562384,
  "isError":false
}
Specific Request Fields:
Response Fields:
Specific Error Flags:
JSON Request Example:
{
  "authTokenValue":"jPmFClqeDUXaEk8Q274q",
  "action":"deleteFile",
  "projectId":23,
  "resourceSetId":143,
  "fileName":"test.txt",
  "moveToTrash":false
}
JSON Response Example (Success Case):
{"fileDeleted":true,"isError":false}
JSON Response Example (Error Case):
{"isError":true,"genericErrorText":"","projectIdError":false,"resourceSetIdError":false,"fileNameError":true}
Specific Request Fields:
Response Fields:
Specific Error Flags:
JSON Request Example:
{
  "authTokenValue":"jPmFClqeDUXaEk8Q274q",
  "action":"getMeasuringAgents"
}
JSON Response Example (Success Case):
{
  "measuringAgentsArray": [
    {
      "agentId": 46,
      "createdBySystem": false,
      "ownerUserId": 13,
      "agentActive": true,
      "agentDescription": "Local Agent",
      "agentHost": "127.0.0.1",
      "agentPort": 8080,
      "authToken": "OrKmpkbyNWEHok"
    },
    {
      "agentId": 49,
      "createdBySystem": false,
      "ownerUserId": 13,
      "agentActive": false,
      "agentDescription": "Rasberry 1",
      "agentHost": "192.168.0.51",
      "agentPort": 8080,
      "authToken": ""
    },
    {
      "agentId": 50,
      "createdBySystem": false,
      "ownerUserId": 13,
      "agentActive": true,
      "agentDescription": "Ubuntu 10",
      "agentHost": "192.168.0.110",
      "agentPort": 8080,
      "authToken": ""
    },
    {
      "agentId": 51,
      "createdBySystem": false,
      "ownerUserId": 13,
      "agentActive": true,
      "agentDescription": "Ubuntu 11",
      "agentHost": "192.168.0.111",
      "agentPort": 8080,
      "authToken": ""
    }
  ],
  "isError": false
}
Specific Request Fields:
Response Fields:
Specific Error Flags:
JSON Request Example:
{
  "authTokenValue":"jPmFClqeDUXaEk8Q274q",
  "action":"getMinRequiredMeasuringAgentVersion"
}
JSON Response Example (Success Case):
{
  "minRequiredMeasuringAgentVersion":"3.9.34",
  "isError":false
}
Specific Request Fields:
Response Fields (JSON object “measuringAgent”):
Specific Error Flags:
JSON Request Example:
{
  "authTokenValue":"jPmFClqeDUXaEk8Q274q",
  "action":"addMeasuringAgent",
  "agentDescription":"Ubuntu 12",
  "agentHost":"192.168.0.112",
  "agentPort":8080,
  "agentActive": true,
  "agentAuthToken": "nixda"
}
JSON Response Example (Success Case):
{
  "measuringAgent": {
    "agentId": 53,
    "createdBySystem": false,
    "ownerUserId": 13,
    "agentActive": true,
    "agentDescription": "Ubuntu 12",
    "agentHost": "192.168.0.112",
    "agentPort": 8080,
    "authToken": "nixda"
  },
  "isError": false
}
Specific Request Fields:
Response Fields (JSON object “agentResponse”):
Specific Error Flags:
JSON Request Example:
{
  "authTokenValue":"jPmFClqeDUXaEk8Q274q",
  "action":"pingMeasuringAgent",
  "agentId":48
}
JSON Response Example (Success Case):
{
  "agentResponse": {
    "pingFromRemoteIp": "83.150.39.44",
    "pingFromRemoteUserId": 13,
    "productVersion": "3.9.30",
    "limitMaxUsersPerJob": 500,
    "limitMaxJobDurationSeconds": 300,
    "osName": "Linux",
    "osVersion": "4.15.0-136-generic",
    "javaVersion": "11.0.1",
    "javaVendor": "Oracle Corporation",
    "javaMaxMemory":"2048 MB",
    "systemTime": 1625513238236,
    "deltaTimeMillis": 841,
    "agentStartupTimeStamp": 1622836702172,
    "httpExecuteTimeMillis": 247
  },
  "isError": false
}
JSON Response Example (Error Case 1):
{
  "isError": true,
  "genericErrorText": "API V1 request to 192.168.0.51:8080 timed out",
  "agentIdError": false,
  "agentAccessDeniedError": false,
  "agentNotReachableError": true,
  "agentVersionOutdatedError": false
}
JSON Response Example (Error Case 2):
{
  "isError": true,
  "genericErrorText": "Min. measuring agent version required: 3.9.30",
  "agentIdError": false,
  "agentAccessDeniedError": false,
  "agentNotReachableError": false,
  "agentVersionOutdatedError": true
}
Specific Request Fields:
Response Fields:
Specific Error Flags:
JSON Request Example:
{
  "authTokenValue":"jPmFClqeDUXaEk8Q274q",
  "action":"setMeasuringAgentActive",
  "agentId":46,
  "agentActive":false
}
JSON Response Example (Success Case):
{"isError":false}
Specific Request Fields:
Response Fields:
Specific Error Flags:
JSON Request Example:
{
  "authTokenValue":"jPmFClqeDUXaEk8Q274q",
  "action":"deleteMeasuringAgent",
  "agentId":54
}
JSON Response Example (Success Case):
{"isError":false}
Specific Request Fields:
Response Fields (JSON array “measuringAgentClustersArray”):
Specific Error Flags:
JSON Request Example:
{
  "authTokenValue":"jPmFClqeDUXaEk8Q274q",
  "action":"getMeasuringAgentClusters"
}
JSON Response Example:
{
  "measuringAgentClustersArray": [
    {
      "clusterId": 11,
      "createdBySystem": false,
      "ownerUserId": 13,
      "clusterActive": true,
      "clusterDescription": "C1",
      "controllerHost": "192.168.0.50",
      "controllerPort": 8083,
      "controllerAuthToken": "aberaber",
      "clusterMembersArray": [
        {
          "clusterMemberId": 59,
          "loadFactor": 1,
          "agentId": 64,
          "agentActive": true,
          "agentDescription": "Agent 1",
          "agentHost": "192.168.0.10",
          "agentPort": 8080,
          "agentAuthToken": "OrKmAAbyNWEHok"
        },
        {
          "clusterMemberId": 60,
          "loadFactor": 1,
          "agentId": 59,
          "agentActive": true,
          "agentDescription": "Ubuntu 10",
          "agentHost": "192.168.0.110",
          "agentPort": 8080,
          "agentAuthToken": "asc7jhacab"
        },
        {
          "clusterMemberId": 61,
          "loadFactor": 1,
          "agentId": 60,
          "agentActive": true,
          "agentDescription": "Ubuntu 11",
          "agentHost": "192.168.0.111",
          "agentPort": 8080,
          "agentAuthToken": "66ascascsdac"
        }
      ]
    },
    {
      "clusterId": 14,
      "createdBySystem": false,
      "ownerUserId": 13,
      "clusterActive": true,
      "clusterDescription": "C2",
      "controllerHost": "192.168.0.50",
      "controllerPort": 8083,
      "controllerAuthToken": "aberaber",
      "clusterMembersArray": [
        {
          "clusterMemberId": 66,
          "loadFactor": 1,
          "agentId": 56,
          "agentActive": true,
          "agentDescription": "Test System",
          "agentHost": "192.168.0.60",
          "agentPort": 8080,
          "agentAuthToken": "aberdoch"
        },
        {
          "clusterMemberId": 67,
          "loadFactor": 1,
          "agentId": 59,
          "agentActive": true,
          "agentDescription": "Ubuntu 10",
          "agentHost": "192.168.0.110",
          "agentPort": 8080,
          "agentAuthToken": "asc7jhacab"
        }
      ]
    }
  ],
  "isError": false
}
Specific Request Fields:
Response Fields (JSON array “clusterControllersArray”):
Specific Error Flags:
JSON Request Example:
{
  "authTokenValue":"jPmFClqeDUXaEk8Q274q",
  "action":"getClusterControllers"
}
JSON Response Example:
{
  "clusterControllersArray": [
    {
      "controllerHost": "192.168.0.33",
      "controllerPort": 8083,
      "controllerAuthToken": "2fasdtfffe",
      "measuringAgentClustersArray": [
        {
          "clusterId": 11,
          "clusterDescription": "C1",
          "clusterActive": 1
        },
        {
          "clusterId": 13,
          "clusterDescription": "C2",
          "clusterActive": 1
        },
        {
          "clusterId": 14,
          "clusterDescription": "C3",
          "clusterActive": 1
        }
      ]
    },
    {
      "controllerHost": "192.168.0.50",
      "controllerPort": 8083,
      "controllerAuthToken": "asfsdgh763",
      "measuringAgentClustersArray": [
        {
          "clusterId": 15,
          "clusterDescription": "C4",
          "clusterActive": 1
        },
        {
          "clusterId": 16,
          "clusterDescription": "C7",
          "clusterActive": 1
        }
      ]
    }
  ],
  "isError": false
}
Specific Request Fields:
Response Fields:
Specific Error Flags:
JSON Request Example:
{
  "authTokenValue":"jPmFClqeDUXaEk8Q274q",
  "action":"getMinRequiredClusterControllerVersion"
}
JSON Response Example:
{
  "minRequiredClusterControllerVersion":"4.0.4",
  "isError":false
}
Specific Request Fields:
Response Fields (JSON object “controllerResponse”):
Specific Error Flags:
JSON Request Example:
{
  "authTokenValue":"jPmFClqeDUXaEk8Q274q",
  "action":"pingClusterController",
    "controllerHost":"192.168.0.50",
    "controllerPort":8083,
    "controllerAuthToken":"hagsajjs99"
}
JSON Response Example (Success Case):
{
  "controllerResponse": {
    "pingFromRemoteIp": "192.168.0.100",
    "pingFromRemoteUserId": 13,
    "productVersion": "4.0.4",
    "osName": "Linux",
    "osVersion": "4.15.0-135-generic",
    "javaVersion": "11.0.1",
    "javaVendor": "Oracle Corporation",
    "javaMaxMemory": "512 MB",
    "systemTime": 1643406118552,
    "deltaTimeMillis": 1120,
    "controllerStartupTimeStamp": 1643322597013,
    "httpExecuteTimeMillis": 249,
    "clusterControllerOutdated": false
  },
  "isError": false
}
JSON Response Example (Error Case 1):
{
  "isError": true,
  "genericErrorText": "API call pingGetControllerInfo failed. Error code = 18, Error message = Invalid authentication token",
  "controllerHostError": false,
  "controllerVersionOutdatedError": false,
  "controllerNotReachableError": true,
  "controllerPortError": false
}
JSON Response Example (Error Case 2):
{
  "isError": true,
  "genericErrorText": "Min. cluster controller version required: 4.0.4",
  "controllerHostError": false,
  "controllerVersionOutdatedError": true,
  "controllerNotReachableError": false,
  "controllerPortError": false
}
Specific Request Fields:
Response Fields:
Specific Error Flags:
JSON Request Example:
{
  "authTokenValue":"jPmFClqeDUXaEk8Q274q",
  "action":"addMeasuringAgentCluster",
  "clusterActive":true,
  "clusterDescription":"C7",
  "controllerHost":"192.168.0.50",
  "controllerPort":8083,
  "controllerAuthToken":"aberaber",
  "clusterMembersArray":[
    {
      "agentId":59,
      "loadFactor":1
    },
    {
      "agentId":60,
      "loadFactor":1
    }
  ]
}
JSON Response Example (Success Case):
{
  "clusterId":16,
  "clusterMembersArray":[
    {
      "clusterMemberId":71,
      "agentId":59,
      "loadFactor":1
    },
    {
      "clusterMemberId":72,
      "agentId":60,
      "loadFactor":1
    }
  ],
  "isError":false
}
JSON Response Example (Error Case):
{
  "isError": true,
  "genericErrorText": "Invalid agentId = 101",
  "controllerHostError": false,
  "agentIdError": true,
  "controllerPortError": false,
  "loadFactorError": false,
  "clusterDescriptionError": false
}
Specific Request Fields:
Response Fields (JSON object “clusterMember”):
Specific Error Flags:
JSON Request Example:
{
  "authTokenValue":"jPmFClqeDUXaEk8Q274q",
  "action":"addMemberToMeasuringAgentCluster",
  "clusterId":17,
  "agentId":64,
  "loadFactor":1
}
JSON Response Example:
{
  "clusterMember": {
    "clusterMemberId": 75,
    "agentId": 64,
    "loadFactor": 1
  },
  "isError": false
}
Specific Request Fields:
Response Fields:
Specific Error Flags:
JSON Request Example:
{
  "authTokenValue":"jPmFClqeDUXaEk8Q274q",
  "action":"removeMemberFromMeasuringAgentCluster",
  "clusterId":17,
  "clusterMemberId":75
}
JSON Response Example:
{"isError":false}
Specific Request Fields:
Response Fields (JSON object “controllerResponse”):
Specific Error Flags:
JSON Request Example:
{
  "authTokenValue":"jPmFClqeDUXaEk8Q274q",
  "action":"pingMeasuringAgentClusterMembers",
  "clusterId":16
}
JSON Response Example (Success Case):
{
  "controllerResponse": {
    "productVersion": "4.0.4",
    "clusterConnectResult": {
      "measuringAgentClusterMemberArray": [
        {
          "clusterMemberId": 71,
          "loadFactor": 1,
          "agentId": 59,
          "agentActive": true,
          "agentDescription": "Ubuntu 10",
          "agentHost": "192.168.0.110",
          "agentPort": 8080,
          "agentAuthToken": "agsdhagsj"
        },
        {
          "clusterMemberId": 72,
          "loadFactor": 1,
          "agentId": 60,
          "agentActive": true,
          "agentDescription": "Ubuntu 11",
          "agentHost": "192.168.0.111",
          "agentPort": 8080,
          "agentAuthToken": "nvbjnvbnn"
        }
      ],
      "connectSuccessfulClusterMemberArray": [
        71,
        72
      ],
      "connectFailedClusterMemberArray": [],
      "clusterConnectStartTimestamp": 1643410829270,
      "clusterConnectDurationMillis": 79
    },
    "clusterActionResult": {
      "actionSuccessfulClusterMemberArray": [
        71,
        72
      ],
      "actionFailedClusterMemberArray": [],
      "jsonResponseClusterMemberArray": [
        {
          "clusterMemberId": 71,
          "jsonResponseObject": {
            "productVersion": "4.0.4",
            "systemTime": 1643410829340,
            "deltaTimeMillis": -10,
            "osName": "Linux",
            "osVersion": "5.4.0-92-generic",
            "javaVersion": "11.0.1",
            "javaVendor": "Oracle Corporation",
            "javaMaxMemory": "2048 MB",
            "samplingGranularityMillis": 4000,
            "isError": false,
            "measuringAgentOutdated": false
          }
        },
        {
          "clusterMemberId": 72,
          "jsonResponseObject": {
            "productVersion": "4.0.4",
            "systemTime": 1643410829351,
            "deltaTimeMillis": -10,
            "osName": "Linux",
            "osVersion": "5.4.0-92-generic",
            "javaVersion": "11.0.1",
            "javaVendor": "Oracle Corporation",
            "javaMaxMemory": "2048 MB",
            "samplingGranularityMillis": 4000,
            "isError": false,
            "measuringAgentOutdated": false
          }
        }
      ],
      "clusterActionStartTimestamp": 1643410829349,
      "clusterActionDurationMillis": 43
    },
    "httpExecuteTimeMillis": 1778,
    "clusterControllerOutdated": false
  },
  "isError": false
}
JSON Response Example (Error Case / Partly failed):
{
  "controllerResponse": {
    "productVersion": "4.0.4",
    "clusterConnectResult": {
      "measuringAgentClusterMemberArray": [
        {
          "clusterMemberId": 71,
          "loadFactor": 1,
          "agentId": 59,
          "agentActive": true,
          "agentDescription": "Ubuntu 10",
          "agentHost": "192.168.0.110",
          "agentPort": 8080,
          "agentAuthToken": "marderzahn"
        },
        {
          "clusterMemberId": 72,
          "loadFactor": 1,
          "agentId": 60,
          "agentActive": true,
          "agentDescription": "Ubuntu 11",
          "agentHost": "192.168.0.111",
          "agentPort": 8080,
          "agentAuthToken": "marderzahn"
        }
      ],
      "connectSuccessfulClusterMemberArray": [
        72
      ],
      "connectFailedClusterMemberArray": [
        {
          "clusterMemberId": 71,
          "errorMessage": "Connection refused (Connection refused)"
        }
      ],
      "clusterConnectStartTimestamp": 1643414272214,
      "clusterConnectDurationMillis": 97
    },
    "clusterActionResult": {
      "actionSuccessfulClusterMemberArray": [
        72
      ],
      "actionFailedClusterMemberArray": [],
      "jsonResponseClusterMemberArray": [
        {
          "clusterMemberId": 72,
          "jsonResponseObject": {
            "productVersion": "4.0.4",
            "systemTime": 1643414272310,
            "deltaTimeMillis": -8,
            "osName": "Linux",
            "osVersion": "5.4.0-92-generic",
            "javaVersion": "11.0.1",
            "javaVendor": "Oracle Corporation",
            "javaMaxMemory": "2048 MB",
            "samplingGranularityMillis": 4000,
            "isError": false,
            "measuringAgentOutdated": false
          }
        }
      ],
      "clusterActionStartTimestamp": 1643414272311,
      "clusterActionDurationMillis": 21
    },
    "httpExecuteTimeMillis": 1769,
    "clusterControllerOutdated": false
  }
}
Specific Request Fields:
Response Fields:
Specific Error Flags:
JSON Request Example:
{
  "authTokenValue":"jPmFClqeDUXaEk8Q274q",
  "action":"setMeasuringAgentClusterActive",
  "clusterId":16,
  "clusterActive":true
}
JSON Response Example (Success Case):
{"isError":false}
Specific Request Fields:
Response Fields:
Specific Error Flags:
JSON Request Example:
{
  "authTokenValue":"jPmFClqeDUXaEk8Q274q",
  "action":"deleteMeasuringAgentCluster",
  "clusterId":16
}
JSON Response Example (Success Case):
{"isError":false}
Specific Request Fields:
Response Fields (JSON array “proxyRecordersArray”):
Specific Error Flags:
JSON Request Example:
{
  "authTokenValue":"jPmFClqeDUXaEk8Q274q",
  "action":"getProxyRecorders"
}
JSON Response Example:
{
  "proxyRecordersArray": [
    {
      "recorderId": 3,
      "createdBySystem": false,
      "ownerUserId": 13,
      "recorderDescription": "Erster",
      "recorderProxyHost": "192.168.0.40",
      "recorderProxyPort": 8082,
      "recorderProxyAuthUsername": "",
      "recorderProxyAuthPassword": "",
      "recorderControlPort": 8081,
      "recorderControlAuthToken": ""
    },
    {
      "recorderId": 4,
      "createdBySystem": false,
      "ownerUserId": 13,
      "recorderDescription": "proxy.realload.com",
      "recorderProxyHost": "proxy.realload.com",
      "recorderProxyPort": 8082,
      "recorderProxyAuthUsername": "max.meier",
      "recorderProxyAuthPassword": "123456",
      "recorderControlPort": 8081,
      "recorderControlAuthToken": "aZujkl97zuwert"
    }
  ],
  "isError": false
}
Specific Request Fields:
Response Fields:
Specific Error Flags:
JSON Request Example:
{
  "authTokenValue":"jPmFClqeDUXaEk8Q274q",
  "action":"getMinRequiredProxyRecorderVersion"
}
JSON Response Example (Success Case):
{
  "minRequiredProxyRecorderVersion":"0.2.2",
  "isError":false
}
Specific Request Fields:
Response Fields (JSON object “proxyRecorder”):
Specific Error Flags:
JSON Request Example:
{
  "authTokenValue":"jPmFClqeDUXaEk8Q274q",
  "action":"addProxyRecorder",
  "recorderDescription":"My New Proxy Recorder",
  "recorderProxyHost":"192.168.0.148",
  "recorderProxyPort":8082,
  "recorderProxyAuthUsername":"max.meier",
  "recorderProxyAuthPassword":"123456",
  "recorderControlPort":8081,
  "recorderControlAuthToken":"aZujkl97zuwert"
}
JSON Response Example (Success Case):
{
  "proxyRecorder": {
    "recorderId": 10,
    "createdBySystem": false,
    "ownerUserId": 13,
    "recorderDescription": "My New Proxy Recorder",
    "recorderProxyHost": "192.168.0.148",
    "recorderProxyPort": 8082,
    "recorderProxyAuthUsername": "max.meier",
    "recorderProxyAuthPassword": "123456",
    "recorderControlPort": 8081,
    "recorderControlAuthToken": "aZujkl97zuwert"
  },
  "isError": false
}
Specific Request Fields:
Response Fields (JSON object “pongResponse”):
Specific Error Flags:
JSON Request Example:
{
  "authTokenValue":"jPmFClqeDUXaEk8Q274q",
  "action":"pingProxyRecorder",
  "recorderId":4
}
JSON Response Example (Success Case):
{
  "pongResponse": {
    "pingFromRemoteIp": "83.150.39.44",
    "pingFromRemoteUserId": 13,
    "productVersion": "0.2.0",
    "recorderComponentVersion": "1.1.0",
    "isRecording": false,
    "recordHostFilter": "www.dkfqa.com",
    "numRecordedElements": 0,
    "osName": "Linux",
    "osVersion": "5.4.0-74-generic",
    "javaMemoryMB": 2048,
    "javaVersion": "11.0.1",
    "javaVendor": "Oracle Corporation",
    "systemTime": 1625529858405,
    "deltaTimeMillis": 790,
    "httpExecuteTimeMillis": 88
  },
  "isError": false
}
JSON Response Example (Error Case):
{
  "isError": true,
  "genericErrorText": "connect timed out",
  "recorderNotReachableError": true,
  "recorderIdError": false,
  "recorderAccessDeniedError": false
}
Specific Request Fields:
Response Fields:
Specific Error Flags:
JSON Request Example:
{
  "authTokenValue":"jPmFClqeDUXaEk8Q274q",
  "action":"deleteProxyRecorder",
  "recorderId":10
}
JSON Response Example (Success Case):
{"isError":false}
Specific Request Fields:
Response Fields:
Specific Error Flags:
JSON Request Example:
{
  "authTokenValue":"jPmFClqeDUXaEk8Q274q",
  "action":"getProxyRecordersClientCertificates"
}
JSON Response Example (Success Case):
{
  "clientCertificatesArray": [
    {
      "certificateId": 1,
      "ownerUserId": 13,
      "recorderId": -1,
      "originalCertFileName": "fischer@dkfqa.com.p12",
      "certFileType": "PKCS#12",
      "certFileDataB64": "MIIRQQ.....CAA=",
      "certPassword": "12345678",
      "certDescription": "Fischer's Cert",
      "certActive": true,
      "applyForHost": "192.168.0.100",
      "applyForPort": 499
    },
    {
      "certificateId": 3,
      "ownerUserId": 13,
      "recorderId": -1,
      "originalCertFileName": "miller@dkfqa.com.p12",
      "certFileType": "PKCS#12",
      "certFileDataB64": "MIIRXB.....CCAA=",
      "certPassword": "abcdefgh",
      "certDescription": "",
      "certActive": false,
      "applyForHost": "www.werwaswo.com",
      "applyForPort": 443
    }
  ],
  "isError": false
}
Specific Request Fields:
Response Fields:
Specific Error Flags:
JSON Request Example:
{
  "authTokenValue":"jPmFClqeDUXaEk8Q274q",
  "action":"addProxyRecordersClientCertificate",
  "recorderId": -1,
  "certFileName": "felix@dkfqa.com.p12",
  "certFileType": "PKCS#12",
  "certFileDataB64": "MIIRQQIBAzCCEQ.....3dUWQICCAA=",
  "certPassword": "mammamia",
  "certDescription":"",
  "certActive": true,
  "applyForHost": "www.dkfqa.com",
  "applyForPort": 443
}
JSON Response Example (Success Case):
{
  "addedClientCertificate": {
    "certificateId": 5,
    "ownerUserId": 13,
    "recorderId": -1,
    "originalCertFileName": "felix@dkfqa.com.p12",
    "certFileType": "PKCS#12",
    "certDescription": "",
    "certActive": true,
    "applyForHost": "www.dkfqa.com",
    "applyForPort": 443
  },
  "isError": false
}
Specific Request Fields:
Response Fields:
Specific Error Flags:
JSON Request Example:
{
  "authTokenValue":"jPmFClqeDUXaEk8Q274q",
  "action":"setProxyRecordersClientCertificateActive",
  "certificateId": 5,
  "certActive": false
}
JSON Response Example (Success Case):
{
  "updatedClientCertificate": {
    "certificateId": 5,
    "ownerUserId": 13,
    "recorderId": -1,
    "originalCertFileName": "felix@dkfqa.com.p12",
    "certFileType": "PKCS#12",
    "certDescription": "",
    "certActive": false,
    "applyForHost": "www.dkfqa.com",
    "applyForPort": 443
  },
  "isError": false
}
Specific Request Fields:
Response Fields:
Specific Error Flags:
JSON Request Example:
{
  "authTokenValue":"jPmFClqeDUXaEk8Q274q",
  "action":"modifyProxyRecordersClientCertificate",
  "certificateId": 5,
  "certDescription": "My Cert",
  "applyForHost": "www.dkfqa.com",
  "applyForPort": 444
}
JSON Response Example (Success Case):
{
  "updatedClientCertificate": {
    "certificateId": 5,
    "ownerUserId": 13,
    "recorderId": -1,
    "originalCertFileName": "felix@dkfqa.com.p12",
    "certFileType": "PKCS#12",
    "certDescription": "My Cert",
    "certActive": false,
    "applyForHost": "www.dkfqa.com",
    "applyForPort": 444
  },
  "isError": false
}
Specific Request Fields:
Response Fields:
Specific Error Flags:
JSON Request Example:
{
  "authTokenValue":"jPmFClqeDUXaEk8Q274q",
  "action":"deleteProxyRecordersClientCertificate",
  "certificateId": 5
}
JSON Response Example (Success Case):
{"isError": false}
JSON Response Example (Error Case):
{"isError": true, "genericErrorText": "Invalid certificate Id"}
Specific Request Fields:
Response Fields:
Specific Error Flags:
JSON Request Example:
{
  "authTokenValue":"jPmFClqeDUXaEk8Q274q",
  "action":"getTestjobTemplates"
}
JSON Response Example (Success Case):
{
  "testjobTemplatesArray": [
    {
      "testjobTemplate": {
        "templateId": 10,
        "templateName": "SimpleTest 1VU",
        "templateDescription": "",
        "testjobProperties": {
          "testjobResultFileName": "",
          "executeMeasuringAgentClusterInfo": "",
          "testjobConcurrentUsers": "1",
          "testjobDescription": "SimpleTest",
          "testjobDebugMeasuring": "false",
          "testjobMaxTestDuration": "30",
          "isClusterJob": "",
          "testjobRampUpTime": "10",
          "localTestjobId": "",
          "testjobMaxLoopsPerUser": "1",
          "productVersion": "4.8.23",
          "remoteTestjobId": "",
          "testjobAdditionalArguments": "",
          "definedFromTestId": "384",
          "testjobSignature": "",
          "testjobDelayPerLoop": "1000",
          "testjobExitCode": "",
          "createTimeStamp": "1694549684261",
          "userInputFieldsFileName": "",
          "testjobType": "load test",
          "enableAutomaticFileSync": "true",
          "testjobState": "invalid",
          "isClusterControllerJobProperties": "",
          "testjobDebugExecution": "false",
          "executeOnUserMeasuringAgentId": "",
          "definedFromTimeZoneId": "Europe/Berlin",
          "executeMeasuringAgentInfo": "",
          "executeOnMeasuringAgentClusterId": ""
        },
        "hasUserInputFields": false
      },
      "testIsHealthy": true
    },
    {
      "testjobTemplate": {
        "templateId": 11,
        "templateName": "SimpleTestWithInputFields 10VU",
        "templateDescription": "",
        "testjobProperties": {
          "testjobResultFileName": "",
          "executeMeasuringAgentClusterInfo": "",
          "testjobConcurrentUsers": "10",
          "testjobDescription": "SimpleTestWithInputFields",
          "testjobDebugMeasuring": "false",
          "testjobMaxTestDuration": "60",
          "isClusterJob": "",
          "testjobRampUpTime": "10",
          "localTestjobId": "",
          "testjobMaxLoopsPerUser": "5",
          "productVersion": "4.8.23",
          "remoteTestjobId": "",
          "testjobAdditionalArguments": "",
          "definedFromTestId": "385",
          "testjobSignature": "",
          "testjobDelayPerLoop": "1000",
          "testjobExitCode": "",
          "createTimeStamp": "1695047319785",
          "userInputFieldsFileName": "InputFields_SimpleTestWithInputFields.json",
          "testjobType": "load test",
          "enableAutomaticFileSync": "true",
          "testjobState": "invalid",
          "isClusterControllerJobProperties": "",
          "testjobDebugExecution": "true",
          "executeOnUserMeasuringAgentId": "",
          "definedFromTimeZoneId": "Europe/Berlin",
          "executeMeasuringAgentInfo": "",
          "executeOnMeasuringAgentClusterId": ""
        },
        "hasUserInputFields": true,
        "userInputFieldsFile": {
          "useShortNames": false,
          "magicPattern": "UserInputFields",
          "productVersion": "4.8.23",
          "userInputFieldsArray": [
            {
              "useShortNames": false,
              "productVersion": "4.8.23",
              "label": "Input Host",
              "variableName": "vHost",
              "inputType": "string",
              "defaultValue": "126.3.4.5",
              "currentValue": "126.3.4.5"
            },
            {
              "useShortNames": false,
              "productVersion": "4.8.23",
              "label": "Input Port",
              "variableName": "vPort",
              "inputType": "integer",
              "defaultValue": "444",
              "currentValue": "444"
            }
          ]
        }
      },
      "testIsHealthy": true
    }
  ],
  "isError": false
}
Specific Request Fields:
Response Fields:
Specific Error Flags:
JSON Request Example:
{
  "authTokenValue":"jPmFClqeDUXaEk8Q274q",
  "action":"defineNewTestjobFromTemplate",
  "templateId":10,
  "measuringAgentOrClusterId":65,
  "isCluster":false,
  "jobDescription": "Simple Test"
}
JSON Response Example (Success Case):
{
  "newTestjobId":33533,
  "isError":false
}
Specific Request Fields:
Response Fields:
Specific Error Flags:
JSON Request Example:
{
  "authTokenValue":"jPmFClqeDUXaEk8Q274q",
  "action":"submitTestjob",
  "localTestjobId":33534
}
JSON Response Example (Success Case):
{
  "isClusterJob": false,
  "agentResponse": {
    "remoteTestjobId": 24129,
    "httpExecuteTimeMillis": 338
  },
  "isError": false
}
Specific Request Fields:
Response Fields:
Specific Error Flags:
JSON Request Example:
{
  "authTokenValue":"jPmFClqeDUXaEk8Q274q",
  "action":"makeTestjobReadyToRun",
  "localTestjobId":33534
}
JSON Response Example (Success Case):
{
  "isClusterJob": false,
  "agentResponse": {
    "testjobProperties": {
      "testjobResultFileName": "",
      "executeMeasuringAgentClusterInfo": "",
      "testjobConcurrentUsers": "1",
      "testjobDescription": "Simple Test",
      "testjobDebugMeasuring": "false",
      "testjobMaxTestDuration": "30",
      "isClusterJob": "false",
      "testjobRampUpTime": "10",
      "localTestjobId": "33534",
      "testjobMaxLoopsPerUser": "1",
      "productVersion": "4.8.18",
      "remoteTestjobId": "24129",
      "testjobAdditionalArguments": "",
      "definedFromTestId": "384",
      "testjobSignature": "Z9B963yIj232nht1DIX5aSRt8m77QuXpvVA5736Tl9Wc7UZ7jOiU3l6UC7y3Nx6CXDDZB4qUg4FHDtTuHsD9xd0T/CSq/g==",
      "testjobDelayPerLoop": "1000",
      "testjobExitCode": "",
      "createTimeStamp": "1695050460395",
      "userInputFieldsFileName": "",
      "testjobType": "load test",
      "enableAutomaticFileSync": "true",
      "testjobState": "ready to run",
      "isClusterControllerJobProperties": "",
      "testjobDebugExecution": "false",
      "executeOnUserMeasuringAgentId": "65",
      "definedFromTimeZoneId": "Europe/Berlin",
      "executeMeasuringAgentInfo": "agent2.realload.com:8080",
      "executeOnMeasuringAgentClusterId": ""
    },
    "httpExecuteTimeMillis": 2871
  },
  "isError": false
}
Specific Request Fields:
Response Fields:
Specific Error Flags:
JSON Request Example:
{
  "authTokenValue":"jPmFClqeDUXaEk8Q274q",
  "action":"startTestjob",
  "localTestjobId":33534
}
JSON Response Example (Success Case):
{
  "isClusterJob": false,
  "agentResponse": {
    "testjobProperties": {
      "testjobResultFileName": "",
      "executeMeasuringAgentClusterInfo": "",
      "testjobConcurrentUsers": "1",
      "testjobDescription": "Simple Test",
      "testjobDebugMeasuring": "false",
      "testjobMaxTestDuration": "30",
      "isClusterJob": "false",
      "testjobRampUpTime": "10",
      "localTestjobId": "33534",
      "testjobMaxLoopsPerUser": "1",
      "productVersion": "4.8.18",
      "remoteTestjobId": "24129",
      "testjobAdditionalArguments": "",
      "definedFromTestId": "384",
      "testjobSignature": "Z9B963yIj232nht1DIX5aSRt8m77QuXpvVA5736Tl9Wc7UZ7jOiU3l6UC7y3Nx6CXDDZB4qUg4FHDtTuHsD9xd0T/CSq/g==",
      "testjobDelayPerLoop": "1000",
      "testjobExitCode": "",
      "createTimeStamp": "1695050460395",
      "userInputFieldsFileName": "",
      "testjobType": "load test",
      "enableAutomaticFileSync": "true",
      "testjobState": "running",
      "isClusterControllerJobProperties": "",
      "testjobDebugExecution": "false",
      "executeOnUserMeasuringAgentId": "65",
      "definedFromTimeZoneId": "Europe/Berlin",
      "executeMeasuringAgentInfo": "agent2.realload.com:8080",
      "executeOnMeasuringAgentClusterId": ""
    },
    "httpExecuteTimeMillis": 249
  },
  "isError": false
}
Specific Request Fields:
Response Fields:
Specific Error Flags:
JSON Request Example:
{
  "authTokenValue":"jPmFClqeDUXaEk8Q274q",
  "action":"getMeasuringAgentTestjobs",
  "measuringAgentId":65,
  "synchronizeLocalTestjobsState":true
}
JSON Response Example (Success Case):
{
  "agentResponse": {
    "allTestjobsArray": [
      {
        "testjobProperties": {
          "testjobResultFileName": "TestResult_RealloadTest_2023-09-09@23-45-34.json",
          "executeMeasuringAgentClusterInfo": "",
          "testjobConcurrentUsers": "1",
          "testjobDescription": "RealloadTest",
          "testjobDebugMeasuring": "false",
          "testjobMaxTestDuration": "60",
          "isClusterJob": "false",
          "testjobRampUpTime": "10",
          "localTestjobId": "30717",
          "testjobMaxLoopsPerUser": "1",
          "productVersion": "4.8.18",
          "remoteTestjobId": "15240",
          "testjobAdditionalArguments": "",
          "definedFromTestId": "379",
          "testjobSignature": "NeYJG4vf8/joAwz4nR4Fie3W0Qr7ijps25ONuk6F5BLghuD8/clPL9mBKc/ogQiic7wI8OXOf53Mi4YDCpg4dQzuaWQ==",
          "testjobDelayPerLoop": "1000",
          "testjobExitCode": "0",
          "createTimeStamp": "1694295923799",
          "userInputFieldsFileName": "",
          "testjobType": "load test",
          "enableAutomaticFileSync": "true",
          "testjobState": "completed",
          "isClusterControllerJobProperties": "",
          "testjobDebugExecution": "true",
          "executeOnUserMeasuringAgentId": "65",
          "definedFromTimeZoneId": "Europe/Berlin",
          "executeMeasuringAgentInfo": "agent2.realload.com:8080",
          "executeOnMeasuringAgentClusterId": ""
        },
        "testProperties": {
          "referencedResourceFilesList": [
            {
              "projectId": 130,
              "testplanId": 203,
              "fileName": "com.dkfqs.selenium.jar"
            },
            {
              "projectId": 130,
              "testplanId": 203,
              "fileName": "commons-io-2.13.0.jar"
            },
            {
              "projectId": 130,
              "testplanId": 203,
              "fileName": "hamcrest-core-1.3.jar"
            },
            {
              "projectId": 130,
              "testplanId": 203,
              "fileName": "com.dkfqs.tools.jar"
            },
            {
              "projectId": 130,
              "testplanId": 203,
              "fileName": "junit-4.13.2.jar"
            },
            {
              "projectId": 130,
              "testplanId": 203,
              "fileName": "selenium_bundle-4.12.1.jar"
            }
          ],
          "jsonConfigObject": {
            "productVersion": "4.8.20",
            "jUnitConfigExecutionClassArray": [
              {
                "productVersion": "4.8.20",
                "executingClassName": "RealloadTest",
                "testMethodNamesArray": [
                  "realload"
                ]
              }
            ],
            "seleniumWebBrowserType": "Firefox"
          },
          "executingScript": "RealloadTest.jar",
          "executingScriptResourceFileList": "",
          "createTimeStamp": "1694293491984",
          "testDescription": "",
          "definedFromTestplanId": "251",
          "productVersion": "4.8.20",
          "definedFromProjectId": "137",
          "visibleTestName": "RealloadTest",
          "scriptType": "Selenium4byJUnit4",
          "testId": "379"
        }
      },
      {
        "testjobProperties": {
          "testjobResultFileName": "TestResult_SimpleTest_2023-09-18@17-01-08.json",
          "executeMeasuringAgentClusterInfo": "",
          "testjobConcurrentUsers": "1",
          "testjobDescription": "Simple Test",
          "testjobDebugMeasuring": "false",
          "testjobMaxTestDuration": "30",
          "isClusterJob": "false",
          "testjobRampUpTime": "10",
          "localTestjobId": "33533",
          "testjobMaxLoopsPerUser": "1",
          "productVersion": "4.8.18",
          "remoteTestjobId": "24112",
          "testjobAdditionalArguments": "",
          "definedFromTestId": "384",
          "testjobSignature": "JYstx+myVNqbyVMr24u4Pi8IXkLGH0iXUquRh5+NL0veKs4DRJX/w2ZT77wLXF70J9YmTPzR7g==",
          "testjobDelayPerLoop": "1000",
          "testjobExitCode": "0",
          "createTimeStamp": "1695049264730",
          "userInputFieldsFileName": "",
          "testjobType": "load test",
          "enableAutomaticFileSync": "true",
          "testjobState": "completed",
          "isClusterControllerJobProperties": "",
          "testjobDebugExecution": "false",
          "executeOnUserMeasuringAgentId": "65",
          "definedFromTimeZoneId": "Europe/Berlin",
          "executeMeasuringAgentInfo": "agent2.realload.com:8080",
          "executeOnMeasuringAgentClusterId": ""
        },
        "testProperties": {
          "referencedResourceFilesList": [
            {
              "projectId": 130,
              "testplanId": 203,
              "fileName": "com.dkfqs.tools.jar"
            }
          ],
          "jsonConfigObject": {},
          "executingScript": "SimpleTest.jar",
          "executingScriptResourceFileList": "",
          "createTimeStamp": "1694549112155",
          "testDescription": "",
          "definedFromTestplanId": "251",
          "productVersion": "4.8.21",
          "definedFromProjectId": "137",
          "visibleTestName": "SimpleTest",
          "scriptType": "OpenJDK11Jar",
          "testId": "384"
        }
      },
      {
        "testjobProperties": {
          "testjobResultFileName": "TestResult_SimpleTest_2023-09-18@17-51-53.json",
          "executeMeasuringAgentClusterInfo": "",
          "testjobConcurrentUsers": "1",
          "testjobDescription": "Simple Test",
          "testjobDebugMeasuring": "false",
          "testjobMaxTestDuration": "30",
          "isClusterJob": "false",
          "testjobRampUpTime": "10",
          "localTestjobId": "33534",
          "testjobMaxLoopsPerUser": "1",
          "productVersion": "4.8.18",
          "remoteTestjobId": "24129",
          "testjobAdditionalArguments": "",
          "definedFromTestId": "384",
          "testjobSignature": "Z9B963yIj232nht1DIX5aSRt8m77QuXYjP9rn4OBSq/g==",
          "testjobDelayPerLoop": "1000",
          "testjobExitCode": "0",
          "createTimeStamp": "1695050460395",
          "userInputFieldsFileName": "",
          "testjobType": "load test",
          "enableAutomaticFileSync": "true",
          "testjobState": "completed",
          "isClusterControllerJobProperties": "",
          "testjobDebugExecution": "false",
          "executeOnUserMeasuringAgentId": "65",
          "definedFromTimeZoneId": "Europe/Berlin",
          "executeMeasuringAgentInfo": "agent2.realload.com:8080",
          "executeOnMeasuringAgentClusterId": ""
        },
        "testProperties": {
          "referencedResourceFilesList": [
            {
              "projectId": 130,
              "testplanId": 203,
              "fileName": "com.dkfqs.tools.jar"
            }
          ],
          "jsonConfigObject": {},
          "executingScript": "SimpleTest.jar",
          "executingScriptResourceFileList": "",
          "createTimeStamp": "1694549112155",
          "testDescription": "",
          "definedFromTestplanId": "251",
          "productVersion": "4.8.21",
          "definedFromProjectId": "137",
          "visibleTestName": "SimpleTest",
          "scriptType": "OpenJDK11Jar",
          "testId": "384"
        }
      }
    ],
    "httpExecuteTimeMillis": 141
  },
  "isError": false
}
Specific Request Fields:
Response Fields:
Specific Error Flags:
JSON Request Example:
{
  "authTokenValue":"jPmFClqeDUXaEk8Q274q",
  "action":"getTestjobOutDirectoryFilesInfo",
  "localTestjobId":33534
}
JSON Response Example (Success Case):
{
  "isClusterJob": false,
  "measuringAgentData": {
    "agentId": 65,
    "createdBySystem": false,
    "ownerUserId": 13,
    "agentActive": true,
    "agentDescription": "Demo Agent 2",
    "agentHost": "agent2.realload.com",
    "agentPort": 8080,
    "authToken": "************",
    "sharedMeasuringAgentTemplateId": -1,
    "isLaunchedByCloudCredits": false
  },
  "filesInfoArray": [
    {
      "fileName": "DataCollector.err",
      "fileSize": 0,
      "lastModified": 1695051456261,
      "mimeType": "application/octet-stream"
    },
    {
      "fileName": "DataCollector.out",
      "fileSize": 5647,
      "lastModified": 1695052318516,
      "mimeType": "application/octet-stream"
    },
    {
      "fileName": "DataCollector.pid",
      "fileSize": 8,
      "lastModified": 1695051456273,
      "mimeType": "application/octet-stream"
    },
    {
      "fileName": "DataCollector.port",
      "fileSize": 6,
      "lastModified": 1695051457729,
      "mimeType": "application/octet-stream"
    },
    {
      "fileName": "DataCollector.state",
      "fileSize": 2,
      "lastModified": 1695052318512,
      "mimeType": "application/octet-stream"
    },
    {
      "fileName": "TestResult_SimpleTest_2023-09-18@17-51-53.json",
      "fileSize": 7421,
      "lastModified": 1695052315488,
      "mimeType": "application/json"
    },
    {
      "fileName": "user_1_statistics.out",
      "fileSize": 5037,
      "lastModified": 1695052313788,
      "mimeType": "application/octet-stream"
    },
    {
      "fileName": "users.out",
      "fileSize": 1923,
      "lastModified": 1695052314000,
      "mimeType": "application/octet-stream"
    }
  ],
  "isError": false
}
Specific Request Fields:
Response Fields:
Specific Error Flags:
JSON Request Example:
{
  "authTokenValue":"jPmFClqeDUXaEk8Q274q",
  "action":"getTestjobOutDirectoryFile",
  "localTestjobId":33534,
  "fileName":"users.out"
}
JSON Response Example (Success Case):
{
  "isClusterJob": false,
  "measuringAgentData": {
    "agentId": 65,
    "createdBySystem": false,
    "ownerUserId": 13,
    "agentActive": true,
    "agentDescription": "Demo Agent 2",
    "agentHost": "agent2.realload.com",
    "agentPort": 8080,
    "authToken": "************",
    "sharedMeasuringAgentTemplateId": -1,
    "isLaunchedByCloudCredits": false
  },
  "fileContentB64": "MjAyMy0wOS0xOCAxNTo1MTo1Mi42MjYgfCBtYWluIHwgSU5GTyB8IE1heC4gSmF2YSBNZW1vcnkgPSAzMzAwIE1CCjIwMjMtMDktMTggMTU6NTE6NTIuNjU1IHwgbWFpbiB8IElORk8gfCBUaW1lIFpvbmUgPSBDb29yZGluYXRlZCBVbml2ZXJzYWwgVGltZSArMDA6MDAKMjAyMy0wOS0xOCAxNTo1MTo1Mi42NjggfCBtYWluIHwgSU5GTyB8IC0tLSB2dnYgLS0tIHJlc291cmNlIGZpbGVzIC0tLSB2dnYgLS0tCjIwMjMtMDktMTggMTU6NTE6NTIuNjY5IHwgbWFpbiB8IElORk8gfCAtLS0gXl5eIC0tLSByZXNvdXJjZSBmaWxlcyAtLS0gXl5eIC0tLQoyMDIzLTA5LTE4IDE1OjUxOjUyLjY2OSB8IG1haW4gfCBJTkZPIHwgLS0tIHZ2diAtLS0gZ2VuZXJpYyBhcmd1bWVudHMgLS0tIHZ2diAtLS0KMjAyMy0wOS0xOCAxNTo1MTo1Mi42NjkgfCBtYWluIHwgSU5GTyB8IHVzZXJzID0gMQoyMDIzLTA5LTE4IDE1OjUxOjUyLjY2OSB8IG1haW4gfCBJTkZPIHwgZHVyYXRpb24gPSAzMAoyMDIzLTA5LTE4IDE1OjUxOjUyLjY3MCB8IG1haW4gfCBJTkZPIHwgbWF4TG9vcHMgPSAxCjIwMjMtMDktMTggMTU6NTE6NTIuNjcwIHwgbWFpbiB8IElORk8gfCBkZWxheVBlckxvb3AgPSAxMDAwCjIwMjMtMDktMTggMTU6NTE6NTIuNjcwIHwgbWFpbiB8IElORk8gfCByYW1wdXBUaW1lID0gMTAKMjAyMy0wOS0xOCAxNTo1MTo1Mi42NzAgfCBtYWluIHwgSU5GTyB8IGRhdGFPdXRwdXREaXIgPSAvaG9tZS9ka2Zxcy9hZ2VudC91c2Vyc0RhdGEvVXNlcl8xMy9UZXN0Sm9icy9UZXN0am9iXzI0MTI5L291dAoyMDIzLTA5LTE4IDE1OjUxOjUyLjY3MCB8IG1haW4gfCBJTkZPIHwgZGVidWdFeGVjID0gZmFsc2UKMjAyMy0wOS0xOCAxNTo1MTo1Mi42NzEgfCBtYWluIHwgSU5GTyB8IGRlYnVnRGF0YSA9IGZhbHNlCjIwMjMtMDktMTggMTU6NTE6NTIuNjcxIHwgbWFpbiB8IElORk8gfCBkZXNjcmlwdGlvbiA9IFNpbXBsZSBUZXN0CjIwMjMtMDktMTggMTU6NTE6NTIuNjcxIHwgbWFpbiB8IElORk8gfCAtLS0gXl5eIC0tLSBnZW5lcmljIGFyZ3VtZW50cyAtLS0gXl5eIC0tLQoyMDIzLTA5LTE4IDE1OjUxOjUyLjkyMSB8IG1haW4gfCBJTkZPIHwgSlZNIFdhcm11cCBwZXJmb3JtZWQgaW4gMjM2IG1zCjIwMjMtMDktMTggMTU6NTE6NTIuOTc3IHwgbWFpbiB8IElORk8gfCAtLS0gdnZ2IC0tLSBzcGVjaWZpYyBhcmd1bWVudHMgLS0tIHZ2diAtLS0KMjAyMy0wOS0xOCAxNTo1MTo1Mi45OTQgfCBtYWluIHwgSU5GTyB8IHRjcFRpbWVvdXQgPSAxMDAwMAoyMDIzLTA5LTE4IDE1OjUxOjUyLjk5NSB8IG1haW4gfCBJTkZPIHwgc3NsVGltZW91dCA9IDUwMDAKMjAyMy0wOS0xOCAxNTo1MTo1Mi45OTcgfCBtYWluIHwgSU5GTyB8IGh0dHBUaW1lb3V0ID0gMzAwMDAKMjAyMy0wOS0xOCAxNTo1MTo1Mi45OTcgfCBtYWluIHwgSU5GTyB8IC0tLSBeXl4gLS0tIHNwZWNpZmljIGFyZ3VtZW50cyAtLS0gXl5eIC0tLQoyMDIzLTA5LTE4IDE1OjUxOjUzLjAwMiB8IG1haW4gfCBJTkZPIHwgW1N0YXJ0IG9mIFRlc3RdCjIwMjMtMDktMTggMTU6NTE6NTMuMDAzIHwgVXNlci0xIHwgSU5GTyB8IFVzZXIgc3RhcnRlZAoyMDIzLTA5LTE4IDE1OjUxOjUzLjAyNiB8IHBlcmlvZGljLXRocmVhZCB8IElORk8gfCBUaHJlYWQgc3RhcnRlZAoyMDIzLTA5LTE4IDE1OjUxOjUzLjAyNiB8IFVzZXItMSB8IElORk8gfCBTdGFydCBleGVjdXRlIHNlc3Npb24gbm8uIDEgLi4uCjIwMjMtMDktMTggMTU6NTE6NTMuNTk3IHwgVXNlci0xIHwgSU5GTyB8IC4uLiBFbmQgZXhlY3V0ZSBzZXNzaW9uIG5vLiAxIHN1Y2Nlc3NmdWwgcGFzc2VkCjIwMjMtMDktMTggMTU6NTE6NTMuNjQ5IHwgVXNlci0xIHwgSU5GTyB8IFVzZXIgbm9ybWFsIHRlcm1pbmF0ZWQKMjAyMy0wOS0xOCAxNTo1MTo1NC4wMDMgfCBtYWluIHwgSU5GTyB8IFtFbmQgb2YgVGVzdF0K",
  "isError": false
}
Specific Request Fields:
Response Fields:
Specific Error Flags:
JSON Request Example:
{
  "authTokenValue":"jPmFClqeDUXaEk8Q274q",
  "action":"saveTestjobOutDirectoryFileToProjectTree",
  "localTestjobId":33534,
  "fileName":"users.out",
  "saveAsFileName":"users.out",
  "projectId":137,
  "resourceSetId":251
}
JSON Response Example (Success Case):
{
  "isClusterJob": false,
  "fileHashCode": 4557110,
  "isError": false
}
Specific Request Fields:
Response Fields:
Specific Error Flags:
JSON Request Example:
{
  "authTokenValue":"jPmFClqeDUXaEk8Q274q",
  "action":"deleteTestjob",
  "localTestjobId":33534,
  "deleteAlsoRemoteTestjob":true
}
JSON Response Example (Success Case):
{
  "isClusterJob": false,
  "localTestjobState": "completed",
  "agentResponse": {
    "httpExecuteTimeMillis": 143
  },
  "isError": false
}
Specific Request Fields:
Response Fields:
Specific Error Flags:
Values of testRunResultsArray[n].executionState :
JSON Request Example:
{
  "authTokenValue":"jPmFClqeDUXaEk8Q274q",
  "action":"getTestExecutionSuites"
}
JSON Response Example (Success Case):
{
  "testExecutionSuitesArray": [
    {
      "testExecutionSuite": {
        "testExecutionSuiteId": 2,
        "testExecutionSuiteName": "First Suite",
        "testExecutionSuiteDescription": "",
        "topExecuteOnMeasuringAgentOrClusterId": "m-145",
        "topExecutionOrder": 2,
        "totalNumberOfTestjobs": 3,
        "isTestExecutionSuiteHealthy": true
      },
      "testRunResultsArray": [
        {
          "userId": 13,
          "subUserId": -1,
          "testRunId": 1,
          "executionState": 2,
          "annotationArray": [],
          "testRunStartTimestamp": 1699716014207,
          "testRunLastUpdatedTimestamp": 1699716054368,
          "numTestjobTemplatesToExecute": 3,
          "numTestjobTemplatesExecutionPassed": 3,
          "numTestjobTemplatesExecutionFailed": 0,
          "totalSessionsPassed": 8,
          "totalSessionsFailed": 0,
          "totalSessionsPassedTimeSum": 5295,
          "totalSamplesPassed": 12,
          "totalSamplesFailed": 0,
          "maxConcurrentUsers": 1,
          "maxPendingSamples": 1
        },
        {
          "userId": 13,
          "subUserId": -1,
          "testRunId": 2,
          "executionState": 2,
          "annotationArray": [],
          "testRunStartTimestamp": 1699716108571,
          "testRunLastUpdatedTimestamp": 1699716151826,
          "numTestjobTemplatesToExecute": 3,
          "numTestjobTemplatesExecutionPassed": 3,
          "numTestjobTemplatesExecutionFailed": 0,
          "totalSessionsPassed": 8,
          "totalSessionsFailed": 0,
          "totalSessionsPassedTimeSum": 5503,
          "totalSamplesPassed": 12,
          "totalSamplesFailed": 0,
          "maxConcurrentUsers": 1,
          "maxPendingSamples": 1
        }
      ]
    },
    {
      "testExecutionSuite": {
        "testExecutionSuiteId": 3,
        "testExecutionSuiteName": "Second Suite Long Run",
        "testExecutionSuiteDescription": "",
        "topExecuteOnMeasuringAgentOrClusterId": "c-27",
        "topExecutionOrder": 1,
        "totalNumberOfTestjobs": 2,
        "isTestExecutionSuiteHealthy": true
      },
      "testRunResultsArray": [
        {
          "userId": 13,
          "subUserId": -1,
          "testRunId": 1,
          "executionState": 2,
          "annotationArray": [],
          "testRunStartTimestamp": 1699715808192,
          "testRunLastUpdatedTimestamp": 1699715867468,
          "numTestjobTemplatesToExecute": 2,
          "numTestjobTemplatesExecutionPassed": 2,
          "numTestjobTemplatesExecutionFailed": 0,
          "totalSessionsPassed": 44,
          "totalSessionsFailed": 0,
          "totalSessionsPassedTimeSum": 4400,
          "totalSamplesPassed": 44,
          "totalSamplesFailed": 0,
          "maxConcurrentUsers": 4,
          "maxPendingSamples": 4
        },
        {
          "userId": 13,
          "subUserId": -1,
          "testRunId": 2,
          "executionState": 2,
          "annotationArray": [],
          "testRunStartTimestamp": 1699715952212,
          "testRunLastUpdatedTimestamp": 1699716012124,
          "numTestjobTemplatesToExecute": 2,
          "numTestjobTemplatesExecutionPassed": 2,
          "numTestjobTemplatesExecutionFailed": 0,
          "totalSessionsPassed": 44,
          "totalSessionsFailed": 0,
          "totalSessionsPassedTimeSum": 4400,
          "totalSamplesPassed": 44,
          "totalSamplesFailed": 0,
          "maxConcurrentUsers": 4,
          "maxPendingSamples": 3
        },
        {
          "userId": 13,
          "subUserId": -1,
          "testRunId": 3,
          "executionState": 2,
          "annotationArray": [],
          "testRunStartTimestamp": 1699717843777,
          "testRunLastUpdatedTimestamp": 1699717905674,
          "numTestjobTemplatesToExecute": 2,
          "numTestjobTemplatesExecutionPassed": 2,
          "numTestjobTemplatesExecutionFailed": 0,
          "totalSessionsPassed": 43,
          "totalSessionsFailed": 0,
          "totalSessionsPassedTimeSum": 4300,
          "totalSamplesPassed": 43,
          "totalSamplesFailed": 0,
          "maxConcurrentUsers": 4,
          "maxPendingSamples": 3
        }
      ]
    }
  ],
  "isError": false
}
Specific Request Fields:
Response Fields:
Specific Error Flags:
JSON Request Example:
{
  "authTokenValue":"jPmFClqeDUXaEk8Q274q",
  "action":"getCurrentlyRunningTestExecutionSuiteIds"
}
JSON Response Example (Success Case):
{
  "testExecutionSuiteIdArray": [
    3
  ],
  "isError": false
}
Specific Request Fields:
Response Fields:
Specific Error Flags:
JSON Request Example:
{
  "authTokenValue":"jPmFClqeDUXaEk8Q274q",
  "action":"startTestExecutionSuiteTestRun",
  "testExecutionSuiteId":3,
  "testRunAnnotation":"",
  "topExecuteOnMeasuringAgentOrClusterId":143,
  "topExecuteOnCluster":false
}
JSON Response Example (Success Case):
{
  "newTestRunId": 5,
  "isError": false
}
JSON Response Example (Error Case):
{
  "isError": true,
  "genericErrorText": "Test execution suite currently running"
}
Specific Request Fields:
Response Fields:
Specific Error Flags:
Values of executionState :
Values of logLevel :
Values of elementType :
Values of executionOrder :
JSON Request Example:
{
  "authTokenValue":"jPmFClqeDUXaEk8Q274q",
  "action":"getTestExecutionSuiteTestRunResultDetail",
  "testExecutionSuiteId":3,
  "testRunId":5
}
JSON Response Example (Success Case):
{
"testRunResultDetail": {
"testRunResult": {
"userId": 13,
"subUserId": -1,
"testExecutionSuite": {
"testExecutionSuiteId": 3,
"testExecutionSuiteName": "Second Suite Long Run",
"testExecutionSuiteDescription": "",
"topExecuteOnMeasuringAgentOrClusterId": "c-27",
"topExecutionOrder": 1,
"testExecutionElementsArray": [
{
"productVersion": "4.8.24",
"elementType": 10,
"elementId": 737867696,
"elementInactive": false,
"executionGroupName": "Top Group",
"executionGroupDescription": "",
"executionOrder": 2,
"executeOnMeasuringAgentOrClusterId": "",
"executionElementsArray": [
{
"productVersion": "4.8.24",
"elementType": 1,
"elementId": 1040705161,
"elementInactive": false,
"templateId": 18
},
{
"productVersion": "4.8.24",
"elementType": 1,
"elementId": 493179849,
"elementInactive": false,
"templateId": 18
}
]
}
]
},
"testjobTemplatesArray": [
{
"templateId": 18,
"templateName": "Simple Test 2VU Long Run",
"templateDescription": "",
"testjobProperties": {
"testjobResultFileName": "",
"executeMeasuringAgentClusterInfo": "",
"testjobConcurrentUsers": "2",
"testjobDescription": "Simple Test 2VU Long Run",
"testjobDebugMeasuring": "false",
"testjobMaxTestDuration": "30",
"isClusterJob": "",
"testjobRampUpTime": "1",
"localTestjobId": "",
"testjobMaxLoopsPerUser": "-1",
"productVersion": "4.8.24",
"remoteTestjobId": "",
"testjobAdditionalArguments": "",
"definedFromTestId": "384",
"testjobSignature": "",
"testjobDelayPerLoop": "3000",
"testjobExitCode": "",
"createTimeStamp": "1697224057753",
"userInputFieldsFileName": "",
"testjobType": "load test",
"enableAutomaticFileSync": "true",
"testjobState": "invalid",
"isClusterControllerJobProperties": "",
"testjobDebugExecution": "false",
"executeOnUserMeasuringAgentId": "",
"definedFromTimeZoneId": "Europe/Berlin",
"executeMeasuringAgentInfo": "",
"executeOnMeasuringAgentClusterId": ""
},
"hasUserInputFields": false
}
],
"testRunId": 5,
"executorLog": {
"userId": 13,
"testExecutionSuiteId": 3,
"testRunId": 5,
"logEntriesArray": [
{
"timestamp": 1699726961703,
"logLevel": 7,
"threadName": "TestSuiteExecutor-S:3-R:5",
"testExecutionElementId": -1,
"logMessage": "Test run #5 started",
"stacktraceArray": []
},
{
"timestamp": 1699726963704,
"logLevel": 7,
"threadName": "TestSuiteExecutorGroup-S:3-R:5-G:737867696",
"testExecutionElementId": 737867696,
"logMessage": "Execution Group 'Top Group' started",
"stacktraceArray": []
},
{
"timestamp": 1699726963706,
"logLevel": 7,
"threadName": "TestSuiteExecutorGroup-S:3-R:5-T:1040705161",
"testExecutionElementId": 1040705161,
"logMessage": "Test Job Template 'Simple Test 2VU Long Run' execution started",
"stacktraceArray": []
},
{
"timestamp": 1699726963708,
"logLevel": 7,
"threadName": "TestSuiteExecutorGroup-S:3-R:5-T:493179849",
"testExecutionElementId": 493179849,
"logMessage": "Test Job Template 'Simple Test 2VU Long Run' execution started",
"stacktraceArray": []
},
{
"timestamp": 1699726963731,
"logLevel": 7,
"threadName": "TestSuiteExecutorGroup-S:3-R:5-T:1040705161",
"testExecutionElementId": 1040705161,
"logMessage": "Test Job Template 'Simple Test 2VU Long Run' test job defined with id = 34442",
"stacktraceArray": []
},
{
"timestamp": 1699726963753,
"logLevel": 7,
"threadName": "TestSuiteExecutorGroup-S:3-R:5-T:493179849",
"testExecutionElementId": 493179849,
"logMessage": "Test Job Template 'Simple Test 2VU Long Run' test job defined with id = 34443",
"stacktraceArray": []
},
{
"timestamp": 1699726964081,
"logLevel": 7,
"threadName": "TestSuiteExecutorGroup-S:3-R:5-T:1040705161",
"testExecutionElementId": 1040705161,
"logMessage": "Test Job Template 'Simple Test 2VU Long Run' test job submitted to 'Shared Agent 2', remote test job id = 791",
"stacktraceArray": []
},
{
"timestamp": 1699726964128,
"logLevel": 7,
"threadName": "TestSuiteExecutorGroup-S:3-R:5-T:493179849",
"testExecutionElementId": 493179849,
"logMessage": "Test Job Template 'Simple Test 2VU Long Run' test job submitted to 'Shared Agent 2', remote test job id = 792",
"stacktraceArray": []
},
{
"timestamp": 1699726968458,
"logLevel": 7,
"threadName": "TestSuiteExecutorGroup-S:3-R:5-T:493179849",
"testExecutionElementId": 493179849,
"logMessage": "Test Job Template 'Simple Test 2VU Long Run' started on 'Shared Agent 2', remote test job id = 792",
"stacktraceArray": []
},
{
"timestamp": 1699726968466,
"logLevel": 7,
"threadName": "TestSuiteExecutorGroup-S:3-R:5-T:1040705161",
"testExecutionElementId": 1040705161,
"logMessage": "Test Job Template 'Simple Test 2VU Long Run' started on 'Shared Agent 2', remote test job id = 791",
"stacktraceArray": []
},
{
"timestamp": 1699727005910,
"logLevel": 7,
"threadName": "TestSuiteExecutorGroup-S:3-R:5-T:493179849",
"testExecutionElementId": 493179849,
"logMessage": "Test Job Template 'Simple Test 2VU Long Run' execution successful",
"stacktraceArray": []
},
{
"timestamp": 1699727006912,
"logLevel": 7,
"threadName": "TestSuiteExecutorGroup-S:3-R:5-T:1040705161",
"testExecutionElementId": 1040705161,
"logMessage": "Test Job Template 'Simple Test 2VU Long Run' execution successful",
"stacktraceArray": []
},
{
"timestamp": 1699727012111,
"logLevel": 7,
"threadName": "TestSuiteExecutorGroup-S:3-R:5-T:1040705161",
"testExecutionElementId": 1040705161,
"logMessage": "Test Job Template 'Simple Test 2VU Long Run' execution terminated",
"stacktraceArray": []
},
{
"timestamp": 1699727012112,
"logLevel": 7,
"threadName": "TestSuiteExecutorGroup-S:3-R:5-T:493179849",
"testExecutionElementId": 493179849,
"logMessage": "Test Job Template 'Simple Test 2VU Long Run' execution terminated",
"stacktraceArray": []
},
{
"timestamp": 1699727012113,
"logLevel": 7,
"threadName": "TestSuiteExecutorGroup-S:3-R:5-G:737867696",
"testExecutionElementId": 737867696,
"logMessage": "Execution Group 'Top Group' terminated",
"stacktraceArray": []
},
{
"timestamp": 1699727014114,
"logLevel": 7,
"threadName": "TestSuiteExecutor-S:3-R:5",
"testExecutionElementId": -1,
"logMessage": "Test run #5 done. Execution state = completed",
"stacktraceArray": []
}
]
},
"executionState": 2,
"annotationArray": [],
"testRunStartTimestamp": 1699726961701,
"testRunLastUpdatedTimestamp": 1699727012113,
"numTestjobTemplatesToExecute": 2,
"numTestjobTemplatesExecutionPassed": 2,
"numTestjobTemplatesExecutionFailed": 0,
"totalSessionsPassed": 44,
"totalSessionsFailed": 0,
"totalSessionsPassedTimeSum": 4400,
"totalSamplesPassed": 44,
"totalSamplesFailed": 0,
"maxConcurrentUsers": 4,
"maxPendingSamples": 2,
"testRunExecutionGroupResultArray": [
{
"testExecutionSuiteId": 3,
"testRunId": 5,
"executionGroupElementId": 737867696,
"containsMeasuringAgent": true,
"measuringAgent": {
"agentId": 143,
"createdBySystem": true,
"ownerUserId": 13,
"agentActive": true,
"agentDescription": "Shared Agent 2",
"agentHost": "192.168.0.50",
"agentPort": 8081,
"sharedMeasuringAgentTemplateId": 5,
"isLaunchedByCloudCredits": false
},
"containsMeasuringAgentCluster": false,
"executionState": 2,
"executionStartTimestamp": 1699726963704,
"executionEndTimestamp": 1699727012113,
"numTestjobTemplatesExecutionPassed": 2,
"numTestjobTemplatesExecutionFailed": 0,
"totalSessionsPassed": 44,
"totalSessionsFailed": 0,
"totalSessionsPassedTimeSum": 4400,
"totalSamplesPassed": 44,
"totalSamplesFailed": 0
}
],
"testRunTestjobResultArray": [
{
"testExecutionSuiteId": 3,
"testRunId": 5,
"testExecutionGroupElementId": 737867696,
"testjobTemplateElementId": 493179849,
"testjobTemplate": {
"templateId": 18,
"templateName": "Simple Test 2VU Long Run",
"templateDescription": "",
"testjobProperties": {
"testjobResultFileName": "TestResult_SimpleTest_2023-11-11@19-22-49.json",
"executeMeasuringAgentClusterInfo": "",
"testjobConcurrentUsers": "2",
"testjobDescription": "Simple Test 2VU Long Run",
"testjobDebugMeasuring": "false",
"testjobMaxTestDuration": "30",
"isClusterJob": "false",
"testjobRampUpTime": "1",
"localTestjobId": "34443",
"testjobMaxLoopsPerUser": "-1",
"productVersion": "4.8.24",
"remoteTestjobId": "792",
"testjobAdditionalArguments": "",
"definedFromTestId": "384",
"testjobSignature": "",
"testjobDelayPerLoop": "3000",
"testjobExitCode": "",
"createTimeStamp": "1697224057753",
"userInputFieldsFileName": "",
"testjobType": "load test",
"enableAutomaticFileSync": "true",
"testjobState": "invalid",
"isClusterControllerJobProperties": "",
"testjobDebugExecution": "false",
"executeOnUserMeasuringAgentId": "143",
"definedFromTimeZoneId": "Europe/Berlin",
"executeMeasuringAgentInfo": "Shared Agent 2",
"executeOnMeasuringAgentClusterId": ""
},
"hasUserInputFields": false
},
"executionState": 2,
"executionStartTimestamp": 1699726963708,
"executionEndTimestamp": 1699727005710,
"jobStartTimestamp": 1699726969618,
"jobEndTimestamp": 1699727003517,
"totalSessionsPassed": 22,
"totalSessionsFailed": 0,
"totalSessionsPassedTimeSum": 2200,
"totalSamplesPassed": 22,
"totalSamplesFailed": 0,
"maxConcurrentUsers": 2,
"maxPendingSamples": 1
},
{
"testExecutionSuiteId": 3,
"testRunId": 5,
"testExecutionGroupElementId": 737867696,
"testjobTemplateElementId": 1040705161,
"testjobTemplate": {
"templateId": 18,
"templateName": "Simple Test 2VU Long Run",
"templateDescription": "",
"testjobProperties": {
"testjobResultFileName": "TestResult_SimpleTest_2023-11-11@19-22-49.json",
"executeMeasuringAgentClusterInfo": "",
"testjobConcurrentUsers": "2",
"testjobDescription": "Simple Test 2VU Long Run",
"testjobDebugMeasuring": "false",
"testjobMaxTestDuration": "30",
"isClusterJob": "false",
"testjobRampUpTime": "1",
"localTestjobId": "34442",
"testjobMaxLoopsPerUser": "-1",
"productVersion": "4.8.24",
"remoteTestjobId": "791",
"testjobAdditionalArguments": "",
"definedFromTestId": "384",
"testjobSignature": "",
"testjobDelayPerLoop": "3000",
"testjobExitCode": "",
"createTimeStamp": "1697224057753",
"userInputFieldsFileName": "",
"testjobType": "load test",
"enableAutomaticFileSync": "true",
"testjobState": "invalid",
"isClusterControllerJobProperties": "",
"testjobDebugExecution": "false",
"executeOnUserMeasuringAgentId": "143",
"definedFromTimeZoneId": "Europe/Berlin",
"executeMeasuringAgentInfo": "Shared Agent 2",
"executeOnMeasuringAgentClusterId": ""
},
"hasUserInputFields": false
},
"executionState": 2,
"executionStartTimestamp": 1699726963706,
"executionEndTimestamp": 1699727006711,
"jobStartTimestamp": 1699726969515,
"jobEndTimestamp": 1699727003517,
"totalSessionsPassed": 22,
"totalSessionsFailed": 0,
"totalSessionsPassedTimeSum": 2200,
"totalSamplesPassed": 22,
"totalSamplesFailed": 0,
"maxConcurrentUsers": 2,
"maxPendingSamples": 1
}
]
},
"executedByUserNickname": "DKF",
"testjobsOutFilesArray": [
{
"elementId": 1040705161,
"outFileInfoArray": [
{
"fileName": "DataCollector.err",
"fileSize": 0,
"lastModified": 1699727006724,
"mimeType": "application/octet-stream"
},
{
"fileName": "DataCollector.out",
"fileSize": 6537,
"lastModified": 1699727006726,
"mimeType": "application/octet-stream"
},
{
"fileName": "DataCollector.pid",
"fileSize": 7,
"lastModified": 1699727006736,
"mimeType": "application/octet-stream"
},
{
"fileName": "DataCollector.port",
"fileSize": 6,
"lastModified": 1699727006737,
"mimeType": "application/octet-stream"
},
{
"fileName": "DataCollector.state",
"fileSize": 1,
"lastModified": 1699727006738,
"mimeType": "application/octet-stream"
},
{
"fileName": "TestResult_SimpleTest_2023-11-11@19-22-49.json",
"fileSize": 11913,
"lastModified": 1699727006739,
"mimeType": "application/json"
},
{
"fileName": "users.out",
"fileSize": 5507,
"lastModified": 1699727006741,
"mimeType": "application/octet-stream"
}
]
},
{
"elementId": 493179849,
"outFileInfoArray": [
{
"fileName": "DataCollector.err",
"fileSize": 0,
"lastModified": 1699727005722,
"mimeType": "application/octet-stream"
},
{
"fileName": "DataCollector.out",
"fileSize": 6264,
"lastModified": 1699727005725,
"mimeType": "application/octet-stream"
},
{
"fileName": "DataCollector.pid",
"fileSize": 7,
"lastModified": 1699727005733,
"mimeType": "application/octet-stream"
},
{
"fileName": "DataCollector.port",
"fileSize": 6,
"lastModified": 1699727005734,
"mimeType": "application/octet-stream"
},
{
"fileName": "DataCollector.state",
"fileSize": 1,
"lastModified": 1699727005735,
"mimeType": "application/octet-stream"
},
{
"fileName": "TestResult_SimpleTest_2023-11-11@19-22-49.json",
"fileSize": 11850,
"lastModified": 1699727005736,
"mimeType": "application/json"
},
{
"fileName": "users.out",
"fileSize": 5507,
"lastModified": 1699727005738,
"mimeType": "application/octet-stream"
}
]
}
]
},
"isError": false
}
Specific Request Fields:
Response Fields:
Specific Error Flags:
JSON Request Example:
{
  "authTokenValue":"jPmFClqeDUXaEk8Q274q",
  "action":"getTestExecutionSuiteTestRunTestJobOutputFileContent",
  "testExecutionSuiteId":3,
  "testRunId":5,
  "testjobTemplateElementId":1040705161,
  "fileName":"users.out"
}
JSON Response Example (Success Case):
{
  "fileContentB64": "MjAyMy0xMS0xMSAxO ... uZCBvZiBUZXN0XQo=",
  "isError": false
}
Specific Request Fields:
Response Fields:
Specific Error Flags:
JSON Request Example:
{
  "authTokenValue":"jPmFClqeDUXaEk8Q274q",
  "action":"deleteTestExecutionSuiteTestRun",
  "testExecutionSuiteId":3,
  "testRunId":5
}
JSON Response Example (Success Case):
{
  "isError": false
}
The “Remote User Monitoring API” is a WebSocket API that supports developers to implement their own version of a Synthetic Monitoring “Real Time Dashboard”.
Similar to the Remote User API there is also an “API Authentication Token” required to access the API.

The API supports the following functions (so-called “actions”):
| WebSocket URL |
|---|
| wss://portal.realload.com/RemoteUserMonitoringAPI |
| HTTP Request Header Fields | |
|---|---|
| x-api-key: <API Authentication Token> | required |
| subscribeToHeartbeat: true | optional |
| subscribeToRealtimeMonitor: true | optional |
The subscribed data are received in JSON format. The received JSON values are never null.
Runtime Behavior
Example:
Send: {"action":"subscribeToHeartbeat"}
Received: {"action":"subscribeToHeartbeat","isError":false}
Received: {"action":"heartbeat","timestamp":1708466543962,"isError":false}
Received: {"action":"heartbeat","timestamp":1708466544963,"isError":false}
Received: {"action":"heartbeat","timestamp":1708466545963,"isError":false}
Implementation Recommendations
Example:
Send: {"action":"pingPortalServer"}
Received: {"action":"pongFromPortalServer","portalServerVersion":"4.8.35","portalServerTimestamp":1708468300516,"isError":false}
{
  "action":"subscribeToHeartbeat"
}
{
  "action":"heartbeat",
  "timestamp":1677521478771,
  "isError":false
}
{
  "action":"subscribeToPeriodicAliveThread",
  "periodicIntervalSeconds":60
}
{
  "action":"periodicAlive",
  "timestamp":1708469366167,
  "isError":false
}
{
  "action":"subscribeToRealtimeMonitor"
}
As first you will receive instantly the configuration data of all already defined Monitoring Groups and Monitoring Jobs, and also the data of the last Execution Result of the Monitoring Groups and Monitoring Jobs (if they have been executed in the past).
After that you will receive update information of all Monitoring Groups and Monitoring Jobs when they are new-defined/modified/deleted, and you will receive also update information about the result of executed Monitoring Groups and Monitoring Jobs.
Because monitoring groups and jobs can be temporarily disabled by configuring one or multiple “Monitoring Downtime(s)” you receive the actions “onMonitoringGroupTemporarilyEvent” and “onMonitoringJobTemporarilyEvent”.

{
  "action": "onMonitoringGroupEvent",
  "monitoringGroupId": 34,
  "monitoringEvent": {
    "eventTimestamp": 1708541771774,
    "monitoringGroup": {
      "monitoringGroupId": 34,
      "ownerUserId": 13,
      "title": "First Group",
      "description": "",
      "maxDataStorageDays": 14,
      "agentType": "agent",
      "executionEnabled": true,
      "executionInterval": 300,
      "executionTimeout": 300,
      "currentExecutionState": "executing",
      "lastExecutionStartTime": 1708541763897
    },
    "monitoringGroupAction": "groupExists"
  },
  "isError": false
}
The executionInterval and the executionTimeout are in seconds. The lastExecutionStartTime has a value of -1 (minus one) if the Monitoring Group was never executed. The agentType has currently no meaning.
Any modification of a Monitoring Group made by the Portal Server Web Interface such as modify executionEnabled or title effects that a new frame with monitoringGroupAction = “groupModified” is received.
{
  "action": "onMonitoringJobEvent",
  "monitoringGroupId": 36,
  "monitoringJobId": 79,
  "monitoringEvent": {
    "eventTimestamp": 1708541771790,
    "monitoringJobProperties": {
      "performanceErrorAlertThresholdMillis": "-1",
      "enableJobExecution": "true",
      "performanceWarningAlertsEnabled": "false",
      "testjobConcurrentUsers": "1",
      "testjobDelayPerLoop": "1000",
      "testjobDebugMeasuring": "false",
      "performanceErrorAlertsEnabled": "false",
      "enableAutomaticFileSync": "false",
      "performanceWarningAlertThresholdMillis": "-1",
      "testjobMaxTestDuration": "60",
      "testjobDebugExecution": "false",
      "testjobRampUpTime": "5",
      "definedFromMonitoringGroupId": "36",
      "testjobMaxLoopsPerUser": "1",
      "productVersion": "4.8.35",
      "monitoringJobId": "79",
      "monitoringJobTitle": "Local_Cinema",
      "lastExecutionStartTime": "1708541731138",
      "testjobAdditionalArguments": "",
      "definedFromTestId": "399",
      "testjobUserInputFieldsValuesJsonArray": "[]",
      "monitoringJobDescription": ""
    },
    "monitoringTestProperties": {
      "referencedResourceFilesList": [
        {
          "projectId": 130,
          "testplanId": 203,
          "fileName": "com.dkfqs.tools.jar"
        }
      ],
      "jsonConfigObject": {},
      "executingScript": "Local_Cinema.jar",
      "executingScriptResourceFileList": "",
      "createTimeStamp": "1708293851731",
      "testDescription": "",
      "definedFromTestplanId": "287",
      "productVersion": "4.8.34",
      "definedFromProjectId": "137",
      "visibleTestName": "Local_Cinema",
      "scriptType": "OpenJDK11Jar",
      "testId": "399"
    },
    "monitoringTestIsHealthy": true,
    "monitoringJobAction": "jobExists"
  },
  "isError": false
}
The testjobMaxTestDuration and the testjobRampUpTime are in seconds. The testjobDelayPerLoop are in milliseconds. The lastExecutionStartTime has a value of -1 (minus one) if the Monitoring Job was never executed.
Any modification of a Monitoring Job made by the Portal Server Web Interface such as modify enableJobExecution or monitoringJobTitle effects that a new frame with monitoringJobAction = “jobModified” is received.
{
  "action": "onMonitoringGroupExecuted",
  "monitoringGroupId": 34,
  "monitoringEvent": {
    "eventTimestamp": 1708541771806,
    "oldEvent": true,
    "groupExecutionResult": {
      "magicPattern": "MonitoringGroupExecutionResult",
      "productVersion": "4.8.35",
      "userId": 13,
      "monitoringGroupId": 34,
      "groupExecutionId": 39412,
      "resultTimestamp": 1708541492973,
      "monitoringJobIdToLocalTestjobIdArray": [
        {
          "monitoringJobId": 60,
          "localTestjobId": 73932
        },
        {
          "monitoringJobId": 61,
          "localTestjobId": 73934
        },
        {
          "monitoringJobId": 62,
          "localTestjobId": 73933
        }
      ],
      "groupSystemStatus": 0,
      "groupCombinedTestjobState": "completed",
      "groupExecutionLogArray": [
        "2024-02-21 19:51:03.915 |  | INFO | Monitoring Group Execution Thread started",
        "2024-02-21 19:51:32.972 |  | INFO | Monitoring Job Id 60 executed",
        "2024-02-21 19:51:32.972 |  | INFO | Monitoring Job Id 62 executed",
        "2024-02-21 19:51:32.972 |  | INFO | Monitoring Job Id 61 executed",
        "2024-02-21 19:51:32.973 |  | INFO | Monitoring Group Execution Thread terminated"
      ],
      "numberOfPassedSamples": 10,
      "numberOfFailedSamples": 0,
      "numberOfPassedLoops": 6,
      "numberOfFailedLoops": 0,
      "sumErrorsSeverityWarning": 0,
      "sumErrorsSeverityError": 0,
      "sumErrorsSeverityFatal": 0
    }
  },
  "hasGroupExecutionStatistic": true,
  "groupExecutionStatistic": {
    "userId": 13,
    "monitoringGroupId": 34,
    "fromTimestamp": 1708455371812,
    "toTimestamp": 1708541771812,
    "systemAvailabilityPercent": 100,
    "measuredAvailabilityPercent": 100,
    "measuredFaultyTimeSumSeconds": 0
  },
  "isError": false
}
groupSystemStatus:
groupCombinedTestjobState
Hint for groupCombinedTestjobState : Note that is value does not reflect if any warnings or errors have been measured by the test jobs.
The Reference Implementation on the Real Load Portal Server shows the measured (sumErrorsSeverityError + sumErrorsSeverityFatal) simple as “number of measured errors”.
{
  "action": "onMonitoringJobExecuted",
  "monitoringGroupId": 36,
  "monitoringJobId": 79,
  "monitoringEvent": {
    "eventTimestamp": 1708541771849,
    "oldEvent": true,
    "jobExecutionResult": {
      "magicPattern": "MonitoringJobExecutionResult",
      "productVersion": "4.8.35",
      "userId": 13,
      "monitoringGroupId": 36,
      "groupExecutionId": 39417,
      "monitoringJobId": 79,
      "localTestjobId": 73939,
      "resultTimestamp": 1708541748100,
      "systemStatus": 0,
      "jobExecutionLogArray": [
        "2024-02-21 19:55:31.137 |  | INFO | Monitoring Job Execution Thread started",
        "2024-02-21 19:55:31.495 | Shared Agent 1 | INFO | Job submitted to measuring agent, remote testjob id = 19015",
        "2024-02-21 19:55:38.034 | Shared Agent 1 | INFO | Job executed on measuring agent, exit code = process executed successfully",
        "2024-02-21 19:55:40.014 | Shared Agent 2 | INFO | Job submitted to measuring agent, remote testjob id = 4864",
        "2024-02-21 19:55:46.446 | Shared Agent 2 | INFO | Job executed on measuring agent, exit code = process executed successfully",
        "2024-02-21 19:55:48.100 |  | INFO | Monitoring Job Execution Thread terminated"
      ],
      "combinedTestjobState": "completed",
      "hasCombinedTestResult": true,
      "combinedTestResultFileName": "TestResult_MonitoringJob_79_2024-02-21@19-55-48.json",
      "combinedTestResultSummaryStatistic": {
        "productVersion": "4.8.35",
        "localTestjobId": 73939,
        "remoteTestjobId": 39417,
        "samplingGranularity": 4000,
        "jobStartTimestamp": 1708541736385,
        "jobEndTimestamp": 1708541744994,
        "osCpuLoadPercent": -1,
        "numberOfPassedLoopsTimeSum": 178,
        "numberOfConcurrentUsers": 0,
        "currentlyPendingSamples": 0,
        "numberOfPassedSamples": 2,
        "numberOfFailedSamples": 0,
        "numberOfPassedLoops": 2,
        "numberOfFailedLoops": 0,
        "numberOfMeasuredErrors": 0,
        "numErrorsSeverityWarning": 0,
        "numErrorsSeverityError": 0,
        "numErrorsSeverityFatal": 0
      },
      "averagePassedLoopTime": 89,
      "sumErrorsSeverityWarning": 0,
      "sumErrorsSeverityError": 0,
      "sumErrorsSeverityFatal": 0
    }
  },
  "hasJobExecutionStatistic": true,
  "jobExecutionStatistic": {
    "userId": 13,
    "monitoringGroupId": 36,
    "monitoringJobId": 79,
    "fromTimestamp": 1708455371849,
    "toTimestamp": 1708541771849,
    "systemAvailabilityPercent": 100,
    "measuredAvailabilityPercent": 100,
    "measuredFaultyTimeSumSeconds": 0,
    "averagePassedLoopTime": 93,
    "hasPassedLoopTimePercentileArray": false
  },
  "isError": false
}
systemStatus:
combinedTestjobState
Hint for combinedTestjobState : Note that is value does not reflect if any warnings or errors have been measured by the test jobs.
The Reference Implementation of the Monitoring Dashboard on the RealLoad Portal Server shows the measured (sumErrorsSeverityError + sumErrorsSeverityFatal) simple as “number of measured errors”.
{
  "action": "onMonitoringGroupTemporarilyEvent",
  "monitoringGroupId": 34,
  "monitoringEvent": {
    "eventTimestamp": 1708541771851,
    "monitoringGroup": {
      "monitoringGroupId": 34,
      "ownerUserId": 13,
      "title": "First Group",
      "description": "",
      "maxDataStorageDays": 14,
      "agentType": "agent",
      "executionEnabled": true,
      "executionInterval": 300,
      "executionTimeout": 300,
      "currentExecutionState": "executing",
      "lastExecutionStartTime": 1708541763897
    },
    "monitoringGroupTemporarilyAction": "groupExecutionTemporarilyNotDisabled"
  },
  "isError": false
}
{
  "action": "onMonitoringJobTemporarilyEvent",
  "monitoringGroupId": 36,
  "monitoringJobId": 79,
  "monitoringEvent": {
    "eventTimestamp": 1708541771854,
    "monitoringJobProperties": {
      "performanceErrorAlertThresholdMillis": "-1",
      "enableJobExecution": "true",
      "performanceWarningAlertsEnabled": "false",
      "testjobConcurrentUsers": "1",
      "testjobDelayPerLoop": "1000",
      "testjobDebugMeasuring": "false",
      "performanceErrorAlertsEnabled": "false",
      "enableAutomaticFileSync": "false",
      "performanceWarningAlertThresholdMillis": "-1",
      "testjobMaxTestDuration": "60",
      "testjobDebugExecution": "false",
      "testjobRampUpTime": "5",
      "definedFromMonitoringGroupId": "36",
      "testjobMaxLoopsPerUser": "1",
      "productVersion": "4.8.35",
      "monitoringJobId": "79",
      "monitoringJobTitle": "Local_Cinema",
      "lastExecutionStartTime": "1708541731138",
      "testjobAdditionalArguments": "",
      "definedFromTestId": "399",
      "testjobUserInputFieldsValuesJsonArray": "[]",
      "monitoringJobDescription": ""
    },
    "monitoringJobTemporarilyAction": "jobExecutionTemporarilyNotDisabled"
  },
  "isError": false
}
{
  "action":"subscribeToMonitoringAlerts"
}
{
  "action": "onMonitoringAlert",
  "monitoringEvent": {
    "eventTimestamp": 1708547148410,
    "monitoringAlert": {
      "userId": 13,
      "alertLevel": "Monitoring Group",
      "alertType": "New Alert",
      "alertId": 579,
      "alertContext": {
        "alertIdUpdateCounter": 0,
        "currentSystemStatus": "Healthy",
        "currentExecutionState": "Successful",
        "currentNumMeasuredWarnings": 0,
        "currentNumMeasuredErrors": 2,
        "previousSystemStatus": "Healthy",
        "previousExecutionState": "Successful",
        "previousNumMeasuredWarnings": 0,
        "previousNumMeasuredErrors": 0
      },
      "monitoringGroupId": 36,
      "monitoringGroupExecutionResult": {
        "magicPattern": "MonitoringGroupExecutionResult",
        "productVersion": "4.8.35",
        "userId": 13,
        "monitoringGroupId": 36,
        "groupExecutionId": 39525,
        "resultTimestamp": 1708547148390,
        "monitoringJobIdToLocalTestjobIdArray": [
          {
            "monitoringJobId": 79,
            "localTestjobId": 74083
          }
        ],
        "groupSystemStatus": 0,
        "groupCombinedTestjobState": "completed",
        "groupExecutionLogArray": [
          "2024-02-21 21:25:31.365 |  | INFO | Monitoring Group Execution Thread started",
          "2024-02-21 21:25:48.383 |  | INFO | Monitoring Job Id 79 executed",
          "2024-02-21 21:25:48.390 |  | INFO | Monitoring Group Execution Thread terminated"
        ],
        "numberOfPassedSamples": 0,
        "numberOfFailedSamples": 2,
        "numberOfPassedLoops": 0,
        "numberOfFailedLoops": 2,
        "sumErrorsSeverityWarning": 0,
        "sumErrorsSeverityError": 2,
        "sumErrorsSeverityFatal": 0
      }
    }
  },
  "isError": false
}
{
  "action": "subscribeToGroupExecutionHistoryCache",
  "monitoringGroupId": 36
}
Error Case
{
  "action": "subscribeToGroupExecutionHistoryCache",
  "isError": true,
  "genericErrorText": "subscribeToGroupExecutionHistoryCache failed: java.lang.IllegalArgumentException: Invalid monitoringGroupId : 35"
}
Received actions:
{
  "action": "onMonitoringGroupExecutionHistoryInitialEntries",
  "monitoringGroupId": 36,
  "monitoringEvent": {
    "eventTimestamp": 1708548777246,
    "historyEntriesArray": [
      {
        "t": 1708463444623,
        "ge": 60,
        "ss": 0,
        "ct": "completed",
        "w": 0,
        "e": 0,
        "f": 0,
        "gid": 37851
      },
      {
        "t": 1708463504557,
        "ge": 60,
        "ss": 0,
        "ct": "completed",
        "w": 0,
        "e": 0,
        "f": 0,
        "gid": 37853
      },
      {
        "t": 1708463563635,
        "ge": 60,
        "ss": 0,
        "ct": "completed",
        "w": 0,
        "e": 0,
        "f": 0,
        "gid": 37854
      },
      {
        "t": 1708548588515,
        "ge": 60,
        "ss": 0,
        "ct": "completed",
        "w": 0,
        "e": 2,
        "f": 0,
        "gid": 39554
      },
      {
        "t": 1708548648466,
        "ge": 60,
        "ss": 0,
        "ct": "completed",
        "w": 0,
        "e": 2,
        "f": 0,
        "gid": 39555
      },
      {
        "t": 1708548708464,
        "ge": 60,
        "ss": 0,
        "ct": "completed",
        "w": 0,
        "e": 2,
        "f": 0,
        "gid": 39557
      },
      {
        "t": 1708548768449,
        "ge": 60,
        "ss": 0,
        "ct": "completed",
        "w": 0,
        "e": 2,
        "f": 0,
        "gid": 39558
      }
    ]
  },
  "isError": false
}
{
  "action": "onMonitoringGroupExecutionHistoryNewEntry",
  "monitoringGroupId": 36,
  "monitoringEvent": {
    "eventTimestamp": 1708549188525,
    "historyEntry": {
      "t": 1708549188468,
      "ge": 60,
      "ss": 0,
      "ct": "completed",
      "w": 0,
      "e": 2,
      "f": 0,
      "gid": 39566
    }
  },
  "isError": false
}
{
  "action": "subscribeToJobExecutionHistoryCache",
  "monitoringJobId": 79
}
Error Case
{
  "action": "subscribeToJobExecutionHistoryCache",
  "isError": true,
  "genericErrorText": "subscribeToJobExecutionHistoryCache failed: java.lang.IllegalArgumentException: Invalid monitoringJobId : 80"
}
Received actions:
{
  "action": "onMonitoringJobExecutionHistoryInitialEntries",
  "monitoringGroupId": 36,
  "monitoringJobId": 79,
  "monitoringEvent": {
    "eventTimestamp": 1708551216713,
    "historyEntriesArray": [
      {
        "t": 1708464823243,
        "ge": 60,
        "ss": 0,
        "ct": "completed",
        "al": 118,
        "w": 0,
        "e": 0,
        "f": 0,
        "lid": 71889,
        "h": true
      },
      {
        "t": 1708464882694,
        "ge": 60,
        "ss": 0,
        "ct": "completed",
        "al": 107,
        "w": 0,
        "e": 0,
        "f": 0,
        "lid": 71890,
        "h": true
      },
      {
        "t": 1708464943399,
        "ge": 60,
        "ss": 0,
        "ct": "completed",
        "al": 96,
        "w": 0,
        "e": 0,
        "f": 0,
        "lid": 71891,
        "h": true
      },
      {
        "t": 1708550987656,
        "ge": 60,
        "ss": 0,
        "ct": "completed",
        "al": -1,
        "w": 0,
        "e": 2,
        "f": 0,
        "lid": 74186,
        "h": true
      },
      {
        "t": 1708551047722,
        "ge": 60,
        "ss": 0,
        "ct": "completed",
        "al": -1,
        "w": 0,
        "e": 2,
        "f": 0,
        "lid": 74187,
        "h": true
      },
      {
        "t": 1708551108599,
        "ge": 60,
        "ss": 0,
        "ct": "completed",
        "al": -1,
        "w": 0,
        "e": 2,
        "f": 0,
        "lid": 74191,
        "h": true
      },
      {
        "t": 1708551167586,
        "ge": 60,
        "ss": 0,
        "ct": "completed",
        "al": -1,
        "w": 0,
        "e": 2,
        "f": 0,
        "lid": 74192,
        "h": true
      }
    ]
  },
  "isError": false
}
{
  "action": "onMonitoringJobExecutionHistoryNewEntry",
  "monitoringGroupId": 36,
  "monitoringJobId": 79,
  "monitoringEvent": {
    "eventTimestamp": 1708551228189,
    "historyEntry": {
      "t": 1708551228183,
      "ge": 60,
      "ss": 0,
      "ct": "completed",
      "al": -1,
      "w": 0,
      "e": 2,
      "f": 0,
      "lid": 74193,
      "h": true
    }
  },
  "isError": false
}
You will also receive other actions than previously described above. These are confirmations that you can ignore. Example:
{
    "action":"subscribeToRealtimeMonitor",
    "isError":false
}
Thank you for using the RealLoad product.
This User Guide gives you an overview of how to use RealLoad and also contains numerous links to relevant details.
The order of the chapters in this guide corresponds to the order of the menus in the Main Navigation Bar.


After you have signed in to the RealLoad Portal, you will see a Main Navigation Bar whose first menu on the left is Projects. This is a file browser that displays all of your files. The view is divided into Projects and Resource Sets which contain all the files for executing your tests and the test results of the executed load tests. You can also store additional files in a Resource Set which contain e.g. instructions on how a test should be performed.
Among other things, you can:
There is also a recycle bin from which you can restore deleted projects, resource sets and files.
In the Developer Tools dropdown menu, there is a wizard that supports converting a Selenium IDE Test to a RealLoad Test, and an example of developing a JUnit Test from scratch.
The Test Menu shows all tests that you have defined. You can also filter the view according to Projects and Resource Sets, and sort the tests in different ways.
Tests can defined:
…and can be executed:

Note that a test is something like a bracket that only contains references to the files that are required for the test execution. There a no files stored inside the test itself.
Each test has a base location from which it was defined (Project + Resource Set) and to where also the load test results are saved.
A test itself can reference its resource files in two ways:
After you have clicked on a test on “Define Test Job”, the intermediate “Define Test Job” menu is displayed.


In contrast to a “test”, all referenced files of the test are copied into the “load test job”. For this reason there is also the option “Synchronize Files at Start of Job” which you should always have switched on. At “Additional Job Arguments” you can enter test-specific command line arguments that are transferred directly to the test program or test script. However, you usually do not need to enter anything.
After you have clicked on “Define Load Test Job” the test job is created and the view changes from the “Tests” menu to the Load Test Jobs menu.
This menu is documented at Synthetic Monitoring.
In this menu all load test jobs are displayed with their states. The green point at the top right next to the title indicates that all measurement agents and cluster controllers which are set to ‘active’ can also be reached. The color of the point changes to yellow or red if one or more ‘active’ measuring agents and cluster controllers cannot be reached / are not available.

A load test job can have one of the following state:
As soon as a job is in the “defined” state, it has a “local job Id”. If the job is then submitted to a measuring agent or cluster controller, the job has additionally a “remote job Id”.
From this menu you can also create Test Job Templates and edit Test Suites - which can be executed as Regression Tests.


After you have clicked on “Start Test Job” in a load test job you can select/modify the Measuring Agent or Cluster of Measuring Agents on which the job will be executed, and you can configure the job settings.

Input Fields:
Normally you do not have to enter any “Additional Arguments” and leave “Debug Execution” and “Debug Measuring” switched off.
After clicking Start Test Job, the job is started on the Measuring Agent or Custer of Measuring Agents and is then in the state “Running”. Then click on “Monitor Jobs” and the view changes from the “Load Test Jobs” menu to the Real Time View menu.

The real time view shows all currently running load test jobs including their measured values and errors.

You can also suspend a running job for a while and resume it later. However this has no effect on the “Max. Test Duration”.

After the job is completed you can click on “Analyze Result”. The view changes then to the Test Results menu.

If you click on “Analyze Result”, the test result is also copied into the Project / Resource Set from which the test was defined. From there you can reload the test result into the Test Results menu at any time.

The “Test Results” menu is a workspace into which you can load multiple test results from any type of test. You can also switch back and forth between the test results. All measured values and all measured errors are displayed. In addition, Percentile Statistics and Diagrams of Error Types are also displayed in this menu.
This menu enables you also to combine several test results into a so-called Load Curve - to determine the maximum number of users that a system such a Web server can handle (see next chapter).

The Summary Statistic of a test result contains some interesting values:
Since several thousand to several million response times can be measured in a very short time during a test, the successfully measured response times are summarized in the response time diagrams at 4-second intervals. For this reason, a minimum value, a average value and a maximum value is displayed for each 4-second interval in such diagrams.
However, this summarization is not performed for Percentile Statistics and for Measured Errors. Every single measured value is taken into account here.
The maximum capacity of a system, such as the maximum number of users that a web server can handle, can be determined by a so-called Load Curve.
To obtain such a Load Curve, you must repeat the same load test several times, by increasing the number of users with each test. For example a test series with 10, 50, 100, 200, 400, 800, 1200 and 1600 users.
The easiest way to repeat a test is to Clone a Load Test Job. You can then enter a higher number of users when starting the cloned load test job.


A measured Load Curve looks like this, for example:

As you can see, the throughput of the server increases linearly up to 400 users - with the response times remaining more or less the same (Avg. Passed Session Time). Then, with 800, 1200 and 1600 users, only individual errors are measured at first, then also many errors, with the response times now increasing sharply.
This means that the server can serve up to 400 users without any problems.
But could you operate the server with 800 users if you accept longer response times? With 800 users, 745,306 URL calls were successfully measured, with only 50 errors occurring.
To find it out, let’s compare the detailed response times of “Page 1” of 400 users with 800 users.
Response Times of “Page 1” at 400 Users:

Response Times of “Page 1” at 800 Users:

The 95% percentile value at 400 users is 224 milliseconds and increases to 1952 milliseconds at 800 users. Now you could say that it just takes longer. However, if you look at the red curve of the outliers, these are only one time a little bit more than 1 second at 400 users, but often more than 8 seconds at 800 users. Conclusion: The server cannot be operated with 800 users because it is then overloaded.
Now let’s do one last test with 600 users. Result:

The throughput of the server at 600 users is a little bit higher than at 400 users and also little bit higher than at 800 users. No errors were measured.
Response Times of “Page 1” at 600 Users:

The 95% percentile value at 600 users is 650 milliseconds, and there are only two outliers with a little bit more than one second.
Final Conclusion: The server can serve up to 600 Users, but no more.
In rare cases it can happen that a test does not measure anything (neither measurement results nor errors). In this case you should either wait until the test is finished or stop it directly in the “Real Time View” menu.
Then you can then acquire the test log files in the “Load Test Jobs” menu and search for errors.


If your test has problems when extracting and assigning variable values, you should also search the log files for error messages. To get detailed information you can run the test once again - but this time with the option “Debug Execution” enabled.

Don’t forget to turn off the “Debug Execution” option after the problem has been solved.

The Network Components menu allows you to manage Measuring Agents, Cluster Controllers and HTTP/S Remote Proxy Recorders. In addition, you can also start additional components that you only need for a short time as AWS Cloud Instances by spending RealLoad Cloud Credits.
On the one hand, depending on your license (Price Plan), you can add and manage Measuring Agents and Cluster Controllers that you operate yourself. On the other hand, you can also launch additional Measuring Agents and Cluster Controllers using RealLoad Cloud Credits.
How to launch and operate Measuring Agents and Cluster Controllers using your own AWS account is documented at AWS Measuring Agents.


HTTP/S Remote Proxy Recorders can be used to record Web Surfing Sessions, which can then be post-processed with the HTTP Test Wizard and converted into a RealLoad Test.
The most important points here are:
The complete documentation is available at HTTP/S Remote Proxy Recorder.
This menu shows (only) all AWS instances that were launched using RealLoad Cloud Credits. Here you can also terminate such instances early - whereby Cloud Credits for complete unused hours are refunded.

This menu only displays the wizards that can be accessed via direct navigation. In addition, the RealLoad product contains numerous other wizards that are accessible depending on the context.

The functionalities of the HTTP Test Wizard (+ Plug-Ins and Published Plug-Ins) is documented at HTTP Test Wizard.
“User Input Fields” are additional values that are entered when starting or defining a test execution and that are available as (global) variables during test execution.
With this wizard you can create or edit JSON files containing definitions of User Input Fields. By convention, the names of such files must always start with ‘InputFields_’ and end with ‘.json’.
A User Input Field contains the following attributes:

User Input Fields are supported by All Types of RealLoad Tests.

This menu contains tools that are helpful for developing and debugging tests:

Submenus:
The following submenus are only accessible depending on your configured “Personal Data & Profile Settings”:

Clicking this icon will open a new browser window or tab to download.realload.com

Clicking this icon will open a new browser window or tab to shop.realload.com
Here you can Purchase Licenses and additional Cloud Credits.
If you have any questions, please email us at support@realload.com
This document describes how to launch Measuring Agents in AWS as EC2 instances. Readers are assumed to be familiar with AWS EC2 terms used in here, in particular if launching Measuring Agents manually.
AWS based Measuring Agents can be launched in three ways:
Launching AWS Measuring Agents via the RealLoad portal is the easiest of the three options. You don’t need an AWS account for this, but RealLoad ‘Clouds Credits’ are required. If you run out of Cloud Credits, you can purchase new ones in the RealLoad Shop: https://shop.realload.com/
Navigate in the Portal to ‘Measuring Agents & Cluster Controllers’.

Them click the AWS icon:

Click on the rocket icon of an AWS region:

Select the ‘AWS/EC2 Instance Type’ (in this example ’t3.xlarge’) and the number of hours until the instance will be terminated (in this example 3 hours). Then click on the ‘Launch Instance’ button:

You will then receive a confirmation notification that the instance has been started. Now you have to wait at least 40 seconds until the instance gets into the running state.

The Measuring Agent is now registered in the portal. You should then ‘Ping’ it to make sure it is functional. If the Ping fails, wait another minute and then try again.


In this example, the Measuring Agent (cloud instance) was started for three hours, but the load test was performed successfully after just one and a half hours. In order to save Cloud Credits, the instance can be terminated early.
To terminate an instance launched by Cloud Credits navigate to ‘Launched Cloud Instances’:

At the relevant instance, click the ‘Terminate Instance’ icon:

Click the ‘Terminate Instance’ button:

The instance will now terminate. In this example you will receive 4 out of a total of 12 cloud credits back.

Navigate to ‘Cloud Credit Statement’ to check your Cloud Credit Balance and Transactions:


Launching AWS Measuring Agents via the Desktop Companion App requires that you have an AWS account.
No additional costs (beyond the costs charged by AWS) apply when using our Measuring Agent images.
Note that you need the rights to log in to the AWS Console to check whether all Measuring Agent instances that are no longer needed have been terminated.
First download, install and configure the Desktop Companion. The download links are published on https://download.realload.com
To configure the Desktop Companion for launching AWS Measuring Agents you need:
To generate a RealLoad ‘API Authentication Token’ sign in to the RealLoad Portal and navigate to ‘My Account’ - ‘API Authentication Tokens’:

Click the ‘Add API Authentication Token’ button:

Enter as purpose ‘Desktop Companion’ and click the ‘Add API Authentication Token’ button. Then copy the shown Token Value to the clipboard or to a text editor:

Now start the Desktop Companion and configure it. Click on the File tab and then click Settings.

In the General Tab enter:
Then click the ‘Test’ button near ‘Authentication Token’:

Switch then to the AWS Tab and enter:
Then click the ‘Test’ button near ‘AWS Secret Access Key’:

Finally, click the ‘OK’ button. The configuration is now complete.
In the Desktop Companion, go to the AWS tab and select an AMI of type ‘MA’ (MA = Measuring Agent). Then launch the instance with a right mouse click:

A window will appear in which you can check the configuration of the instance and set the instance auto-terminate time period. You can also choose a value of zero for the auto-terminate time period, which means that the instance will continue to run until you stop it.

For technical reasons, it may happen that a Measuring Agent instance was not automatically terminated.
Follow the instructions at Double-check no longer needed Instances
The instance is then launched and in the state ‘pending’:

Now wait until the instance reaches the ‘running’ state. Then register the instance in the portal with a right mouse click:

The instance is now also displayed in ‘Portal Agents Registration’:

Check in the RealLoad Portal whether the instance is running correctly by pinging the Measuring Agent at application level:


Note that this section only applies to Measuring Agent instance which have launched via the Desktop Companion.
Two steps are necessary to terminate an instance:
To terminate an instance in AWS, perform a right mouse click in the Desktop Companion - Running AWS Images in “My Regions” at the corresponding instance and select ‘Terminate’:

The instance is then in the state ‘shutting-down’. Now you can deregister the Measuring Agent in the portal server by a right mouse click:

Because the Desktop Companion only shows Running AWS Images in “My Regions”, some instances launched in other AWS Regions may not be displayed.
Sign in to the AWS console to review Measuring Agent instances across all AWS regions. Select EC2 Global View:

In EC2 Global View click Global search and select the the tag REAL_LOAD_AGENT:

Select the operator Equals and set the value to true, then hit the return key:

If the list displayed contains one or more instances, click on the instance(s):

Memorize the instance ID and terminate the instance:

Sign in into the RealLoad Portal and delete the corresponding Measuring Agent:

In EC2, first select the AWS Region where you want to launch the Measurement Agent instance.
In order for the AMI to be reachable from the RealLoad Portal you’ll need to configure a Security Group allowing inbound TCP/IP V4 connections to port 8080 as a minimum. Optionally, you can also configure SSH access.
In the following example the security group “Real Load Agent Security Group” was created:

When launching the instance click Browse more AMIs:

Then click Community AMIs, enter our (RealLoad) AWS account 775953462348 and select the Measuring Agent image:

Add the tag REAL_LOAD_AGENT = true

Select the Instance Type and set the (existing) Security Group “Real Load Agent Security Group”. Optionally you may also set a Key Pair:

Scroll down and click Advanced Details:

In Advanced Details scroll down to User Data. In order to protect access to your Measuring Agent we strongly recommend setting a non-default secret when launching the instance.
The secret can be set at launch time by providing User Data to the AMI as follows (replace “secret” with the secret of your choice):
#!/bin/sh
echo "AGENT_SECRET=secret" > /home/ec2-user/agent_secret.sh

Scroll down to the bottom of the AWS Console and click Launch Instance:

After launching the instance click on the instance ID:

Copy the Public IPv4 address of the instance to a text editor or to the clipboard:

Sign In to the RealLoad Portal and add (=register) the Measuring Agent instance:

The Agent IP Port wil always be 8080. Enter the Auth Token which you have set as AGENT_SECRET when launching the instance.

Then ping the Measuring Agent at application level:


And check the Measuring Agent Log File to verify that the Agent Secret was configured:


The Measuring Agent is now ready for operation. Don’t forget to terminate the instance when you no longer need it.
Once you have terminated the instance, you should delete the corresponding Measuring Agent in the RealLoad Portal.
This document describes how a Web Surfing Session can be recorded by using a HTTP/S Remote Proxy Recorder and then post-processed in the HTTP Test Wizard. After post-processing, a RealLoad Test can be generated.
The following assumes that a Firefox web browser is used for recording and that the CA Root Certificate of the HTTP/S Remote Proxy Recorder has already been imported into Firefox.
You must also have the ‘RealLoad Test Recorder’ browser extension installed in Firefox. It is recommended to only turn on this browser extension when recording a Web Surfing Session.
The following text describes how to copy and paste a HTTP/S Remote Proxy Recorder Configuration into the Firefox ‘RealLoad Test Recorder’ browser extension.
You now need two web browsers from different manufacturers:
In Firefox navigate to Manage Extensions

At the RealLoad Test Recorder extension click Options


Now use the Chrome browser, sign in to the RealLoad portal, navigate to the HTTP/S Remote Proxy Recorders menu, and Connect to the Proxy Recorder

After you are connected to Proxy Recorder with the Chrome browser, click on the ‘Red Eye Icon’ and copy the ‘Proxy Configuration Data’ to the Clipboard by clicking the corresponding icon

Then paste the ‘Proxy Configuration Data’ to the Firefox ‘RealLoad Test Recorder’ browser extension and click ‘Save’

Firefox is now ready for recording.
Tip: You can also Pin the ‘RealLoad Test Recorder’ browser extension to the Firefox Toolbar:


The following example shows the recording of the purchase of a Cinema Voucher in the RealLoad Cinema Demo Shop.
cinema.realload.com is a public server available to you for educational purposes.
In the Chrome browser connect via portal to the Proxy Recorder and click on the ‘Red Eye Icon’:

In Firefox click the ‘RealLoad Test Recorder’ browser extension. When you are asked for the Proxy Authentication then paste the username and password shown in Chrome.

In the ‘RealLoad Test Recorder’ browser extension first enable Clear Cache & Cookies and then click Start Recording

In Firefox enter the URL https://cinema.realload.com/shop which is the starting point of the recorded session.

Optional: Have a look at Chrome and you will see that the first web page is recorded:

A cinema voucher will now be added to the shopping cart. In Firefox first insert a ‘Page Break’ with the comment ‘Add Cinema Voucher’, and then click on ‘Add to Chart’ in the shop:

Add another Page Break with the comment ‘Goto Chart’, and then click the Cart Icon:


The shopping cart is now displayed. Add another Page Break with the comment ‘Checkout and Pay’, and then click ‘Checkout and Pay’:

The receipt will be displayed and the recording is now complete.
In the ‘RealLoad Test Recorder’ browser extension, click Stop Recording:

Now return to the Chrome browser and click on ‘Refresh’. As you can see, a lot of URLs were recorded that were unwanted in your test. Click on URL Filter - Quick Settings to filter out the unwanted URLs:

Exclude any web servers that you do not want to be part of your test. In particular, you should exclude any tracking servers.

Then save the recorded session. You can later re-load the recorded session to (any) proxy recorder and filter it again:

After completing the recording, it is strongly recommended to switch off the ‘RealLoad Test Recorder’ browser extension. Only turn this browser extension on again when you record a new web surfing session.

In the HTTP/S Remote Proxy Recorder click ‘Convert’

Enter the Headline of the HTTP Test Wizard session (in this case ‘Purchase Cinema Voucher’) and click ‘Convert’:

The recording will now be converted and appears in the HTTP Test Wizard. We recommend that you save the HTTP Test Wizard session first before you start post-processing.


If a dynamic value such as a order number is part of an HTTP response, and that value is then used in subsequent HTTP requests, you must handle this value using a dynamic session variable.
To identify such dynamic values, you can use the Variables Wizard, which you can access via the HTTP Test Wizard. First click on URL Explorer

Then in the URL Explorer click Variables Wizard

Now a list of Distinct Transmitted Values is shown in the Variables Wizard, which is extracted from all HTTP request of the session. The challenge now is to estimate which of these values are dynamic (static values do not need to be handled).
As a rule of thumb:
In the image below there is only one dynamic value (receiptId = e1bjlSo9CoJLR9TL). Click on the magnifying glass icon to handle this value:

The session is now searched for this dynamic value e1bjlSo9CoJLR9TL. Click on the first search result of an HTTP response:

In this example, the HTTP response is in JSON data format. So click on the JSON tab:

Then click on the value of receiptId, and then click Test Extractor and enter a new Variable Name ‘(vReceiptId’ in this case). Finally enable the switch Assign Extracted Value as Variable to All Subsequent HTTP Requests and click the Define Variable Extractor button.

The handling of the dynamic session variable is now complete. Click the ‘Variables’ icon to check the variable extractor and variable assigners:

After you have processed all dynamic values, you should save the session again.
When the recording was converted, the verification of the HTTP responses were also automatically configured.
The received HTTP status code of each URL is always checked for the value it had at the time of recording. However, some URLs may also be automatically configured to additionally validate the response content against a text fragment. You should review these URL-specific text fragments and correct them if necessary.
In the HTTP Test Wizard click on Review and Edit URL Settings

Take a look at table column ‘V. Text’ and click on the text fragment wizard icons:

For example, for the URL https://cinema.realload.com/shop, it is better to choose the text fragment ‘RealLoad Cinema Demo Shop’ instead of ‘clone the product card template’:

After you have reviewed the content validations of the HTTP responses, you should save the session again - if you have made any changes.
After you have completed the post-processing, we recommend that you debug the HTTP Test Wizard session.

Since this is a Remote Debugger, you can choose which Measuring Agent the debugger runs on. This means you can also debug the session from different geographical locations.

Click on ‘Next Step’ until you reach the end of the session - or until an error is displayed. During debugging you will also see when the value of dynamic session variable is extracted from an HTTP response and when it is assigned to an HTTP request.


If you were able to debug the session without errors, you can now generate a RealLoad Test from it. Click on ‘Generate Code’:

First click on ‘Generate Source Code’ and then on ‘Compile & Generate JAR’:

Then click ‘Define New Test’:

You can adjust the name of the test a little (it can also contain spaces). Then click on ‘Define New Test’:

Your browser will now be redirected to the ‘Tests’ menu and the test will appear at first position (if the sorting is set to descending test ID).

From here you can continue as described at the Tests Menu.

The HTTP Tests Wizard supports you to create sophisticated tests in an easy way. You can:
As the name suggests, the HTTP Tests Wizard is optimized for the execution of HTTP/S tests. However, by using HTTP Tests Wizard Plug-Ins, any other protocols can also be tested and measured (similar to JUnit Tests).
HTTP Tests Wizard Features:
The test sequence is referred to as a so-called “Session”, whereby each simulated user repeatedly executes the session in a loop (so called “User Session” or “Session Loop”).

In order to define a test sequence, you can add various Session Elements to a session:
If an (existing) session element is selected, the new session element is inserted after it. Or if no session element is selected, the new session element will be added at the end of the session.
By clicking on the index of a session element, you can copy, cut, paste, and delete it. You can also disable and re-enable the execution of the session element.

By clicking on the ‘Select Multiple Session Elements’ icon, you can copy, cut, paste, and delete multiple session elements:

By clicking on the ‘Variables’ icon the list of all variables is shown. Here you can also define new variables and modify their scope and default value. Furthermore all extractors and assigners for each variable are displayed:

A variable can have the following Scope:

See also Handling of Dynamic Session Values.
With the URL Explorer you can view and search the HTTP data of the URLs, and also post-edit (extract and assign) dynamic session values.


See Handling of Dynamic Session Values.
If you entered the session manually (i.e. did not record it with a proxy recorder), the HTTP data for the URLs will be empty because they are currently unknown. However, you can use the debugger and handle dynamic session values directly in the debugger:

All definitions regarding variables that you make in the debugger are transferred directly to the HTTP Test Wizard session.
There is another option in the debugger where you can transfer the HTTP data from the URLs into the URL Explorer by clicking on each executed URL at the HTTP response to the ‘Set/Update Recorded URL’ icon:


Afterwards it will look something like this in the URL Explorer and you can continue as described at Handling of Dynamic Session Values.

After you’ve finished post-editing the session - and the session is working with the debugger - you should take a look at the content verification of the HTTP responses of all URLs. For example, maybe you forgot to verify the HTTP response status code for some URLs. For this purpose invoke the ‘Review and Edit URL Settings’ wizard:

You can also select several URLs here and edit them together:


We also recommend you take a look at Reviewing the HTTP Response Content Validations.
A ’normal’ browser loads certain URLs of a website in parallel. For example, images are loaded in parallel. The same behavior can also be achieved in the HTTP Test Wizard by calling the ‘AutoConfig Asynchronous URL Execution’ wizard. However, please note that this wizard is not perfect - you will probably need to manually adjust the execution of the URLs

After calling the wizard, the execution of the URLs will look like this, for example:

Of course, not all URLs are executed in parallel at the same time. As with a web browser, the HTTP requests are first entered into a queue and then processed by a few working threads (typically 4 threads).
By calling the wizard again you can undo the configuration.
This is documented at Recording of a Web Surfing Session.
“User Input Fields” are additional values that are entered when starting or defining a test execution and that are available as (global) variables during test execution.
A User Input Field contains the following attributes:
See also Starting a Load Test Job
Adding Measurement Group(s) is optional and causes the execution time of all subsequent session elements to be displayed in aggregate. The end of a measurement group is defined by either adding another measurement group or reaching the end of the session.
Note: If you Record a Web Surfing Session using a Proxy Recorder, a measurement group is automatically added to the session every time you enter a Page Break.
When adding an URL you have at least to select the HTTP Method (for example GET) and to enter the absolute URL (https://<host>/path).
Checking the HTTP response code is optional, but strongly recommended, as otherwise the test result may contain false positive results.

The following fields can be entered or selected:
If you have manually added URLs and configured them to run in parallel (asynchronous) with other URLs, you must add a URL Synchronisation Point after the end of all URLs running in parallel.
See also Configuring Parallel URL Execution
This session element delays execution for a certain time.
The following fields can be entered or selected:
This session element adds a Authorization: Basic <credentials> HTTP request header field to the HTTP requests of the URLs.
The following fields can be entered or selected:
Using this session element, one or multiple SSL/TLS Client Certificates can be configured, which are used for HTTPS server authorization.
The following fields can be entered or selected:
This session element adds a HTTP request header field to the HTTP requests of the URLs.
The following fields can be entered or selected:
Using this session element, HTTP Cookies can be manipulated - regardless of whether they are “HttpOnly cookies” or not.

Tip: You can use the Debugger to examine the cookies.


Extracts the value of a cookie into a variable. The following fields can be entered or selected:
Assigns the value of a variable to the value of a cookie. The following fields can be entered or selected:
Adds or overwrites a cookie. The following fields can be entered or selected:
Deletes a cookie. The following fields can be entered or selected:
Deletes all session cookies.
Deletes all cookies.
The dynamic assignment of multiple outbound IP addresses for the executed URLs of the simulated users is only possible if you operate specially configured Measuring Agents yourself - or have them operated by us.
Basically, every internet device only has a single routable IP address. However, each operating system can be reconfigured so that it supports multiple IP addresses - if the network environment allows it and the additional IP addresses are also routable.
The Outbound IP Addresses are set by a Variable (often extracted from an Input File), where the Scope of the Variable determines how the Outbound IP Addresses are assigned to the simulated users.

This session element performs a conditional jump (conditional GoTo) to any other session element, based on a fixed value or on the value of one or several variables. The number of jumps is counted and can also control the conditional execution.

Conditional Jumps are based on a Conditional Expression whose result is always true or false. If the condition is true, the test execution of the currently executed user session jumps to the addressed (target) session element.
Two types of Condition Interpreters are supported:
One or multiple Placeholder for Variables in the format ${variable-name} can be used at any point in a Conditional Expression:
The Boolean Expression Interpreter supports:
Supported comparison operators:
Supported boolean operators:
Parsing of values:
Text values enclosed in double quotes are not converted to a number.
The Boolean Regex Interpreter requires two arguments:
A target session element can be:
The jump action is performed when the jump is executed (if Conditional Expression == true):
This is the limit of the maximum executed jumps per user session (per session loop) - applied to this conditional jump. For jumps back to previous session elements, this limit should never be ‘unlimited’, otherwise this can end in an endless loop.
After this limit has been reached, the Action: If Max. Number of Jumps Exceeded rules what happens next.
One of the following actions can be configured if the limit of ‘Max. Number of Jumps’ is exceeded for this conditional jump:
See Plug-Ins.
Input files are text files (*.txt, *.csv) whose content is read line by line during the test. Each line is divided into tokens from which values of variables are extracted. Empty lines are skipped. Note that the variables whose values will be extracted from the input file must first be defined before you can add an input file.
The following fields can be entered or selected:

Output files are text files (*.txt, *.csv) into which values of variables are written. The file is saved in the output directory of the test job.
The following fields can be entered or selected:


Plug-Ins are reusable HTTP Test Wizard extensions that are manually programmed. They can also be published by manufacturing users and imported by other users. Therefore, before you start programming your own plug-in, take first a look at the already published plug-ins.
There are 3 types of plug-ins:


For copyright and security reasons, the published plug-ins only contain the source code, but not the compiled code and no third-party JAR libraries that may be required.
If third-party JAR libraries are required, the “Plug-in Description” provides instructions on how to download these libraries. Third-party JAR libraries should always be saved in the project/resouce set “Resources Library/Java”.
After you have imported the plug-in you have to load and compile it - then save the compiled plug-in.


After you have saved the compiled plug-in you can add it to your HTTP Test Wizard session. Plug-ins of the type “Java Source Code Modifier Plug-Ins” do not have to be added, but can be called directly after the source code of the test program has been generated.
In order to get support from the plug-in manufacturer, you have to enable in your Profile Settings the option “Public In-App User”. Then you can communicate with the plug-in manufacturer via “In-App Messages”.

Own plug-ins can be developed in Java 8 or 11. The following example shows a plug-in which decode a base64 encoded string.


After clicking at “New Plug-In” the plugin type has to be selected (in this example “Normal Session Element Plug-In”):

At the “General Settings” tab you have at least to enter the Plug-In Title and the Java Class Name. You should als enter a Plug-In Description which can be formatted by simple HTML tags. The onInitialize Scope can be set to “Global”, as this plug-in does not require any initialization. The onExecute Scope is set to “User Session” in order that all kind of variable scopes are supported.

At the next tab - “Input & Output Values” - a plug-in input and a plug-in output (Java-)variable is defined for the plug-in method onExecute. The values of this two Java variables will later correspond with two HTTP Test Wizard variables (which may have a different variable name):

When you click at the next tab - “Resources Files” - you will see that the Java library com.dkfqs.tools.jar is already added to the plugin. This is normal as all kind of plug-ins require this library. Here you may add also other Java libraries required by the plug-in - but in this case no other libraries are needed.

Now at the “Source Code & Compile” tab, you can first generate the plug-in template. Then you have to extend the generated code with your own code, ie in this example you have to complete the Java import definitions and program the inner logic of the Java method onExecute. Then compile the plug-in.


At the last tab “Test & Save” you can first test the plug-in (remotely) on any Measuring Agent. To perform the test enter for example “SGVsbG8gV29ybGQ=” as input and you will see as output “Hello World”.


Finally save the plug-in:

After you have saved the plug-in click at the “Close” button. Then you will see the new plug-in in the plug-in list:

If your plug-in can be used universally, it would be nice if you also publish it - to make it available to other users.
Note that you have to enable in your Profile Settings the option “Public In-App User” in order that you entitled to publish plug-ins.
Publishing plug-ins is especially useful for users who have additionally activated the option “Publish My Profile as Technical Expert” in their Profile Settings. This will significantly improve your visibility and competence.


The HTTP Test Wizard Debugger is a powerful tool with some special features:

The executing Measuring Agent can be selected in the upper right corner. The debugger is reset when you select another Measuring Agent.

If your session contains User Input Fields, you will be prompted to enter their values when the debugger is initialized or reset.

Reading the lines of Input Files is automatically processed by the debugger. However you can force the debugger to jump over the lines of an Input File.


Click Next Step repeatedly to debug the session.
If you want to assign the value of a variable to an HTTP request, briefly enable HTTP Requests Breakpoint before the URL is executed. After that, you should disable this option.

Click the received HTTP Response Header or Response Content of a URL to extract a value into a variable:

This example extracts the value of a JSON response into a variable. If the variable does not yet exist, you can define it first.

Proceed as follows

This example assigns the value of a variable to a JSON HTTP request content:


By using an HTTP/S Remote Proxy Recorder, the HTTP/S traffic from Web browsers and technical Web clients can be recorded and easily converted into a HTTP Test Wizard session.
The HTTP Test Wizard session can then be post-processed and debugged. Finally, an executable test can be generated from the recorded session.
If you do not operate your own HTTP/S Remote Proxy Recorder (or have us to operate it), a shared HTTP/S Remote Proxy Recorder from our pool will be assigned to you, which will be available temporarily to you, as long as you are logged into the portal. This means that when you log out and log back into the portal, a different shared HTTP/S Remote Proxy Recorder may be assigned to you.
Alternatively, you can install the Desktop Companion application on your computer. This application also has an integrated HTTP/S Proxy Recorder which has roughly the same functionality as a HTTP/S Remote Proxy Recorder.

An HTTP/S Remote Proxy Recorder has two service ports:
All data traffic that passes through the proxy port is first decrypted by the Proxy Recorder and then encrypted again before it is forwarded to the target Web server(s).
In order to record a Web surfing session by a Web browser you have to start two different Web browser products on your local machine. For example:
We recommend to use always Firefox as Web Browser 2.
To be able to record a Web surfing session, you have to reconfigure Web Browser 2
Additional note: Before you start recording a Web surfing session in Web Browser 2, you must always clear the browser cache.
Once the recording is completed you should undo the configuration changes in Web Browser 2 (restore the original network settings and delete the Proxy Server CA Root Certificate).
The following describes how you can import the CA Root Certificate of a Proxy Recorder in the Firefox Web Browser.
Sign in to the portal, navigate to the HTTP/S Remote Proxy Recorders menu, and download the CA Root Certificate of the Proxy Recorder to any folder on your computer:


Note: The image above shows the certificate of a shared proxy recorder (whereby all shared proxy recorders use the same CA root certificate). However, the ‘Subject’ of the certificate could also have other values, depending on the proxy recorder. So that you can find the certificate in Firefox and delete it if necessary, you should remember the values of the ‘Certificate Subject’ (or take a photo of the certificate properties with your mobile phone).
In Firefox call Settings:

Click Privacy & Security:

Scroll down to Security - Certificates, and click ‘View Certificates…’

In the Firefox Certificate Manager click first on Authorities and then on ‘Import…’

Select the CA Root Certificate you downloaded before and check the “Trust this CA to identify websites” box. Then click OK

The CA Root Certificate is now imported into Firefox:

After you have installed a Proxy Recorder’s CA Root Certificate in a web browser product (in this case, Firefox), you can record web surfing sessions, but you can no longer trust the web browser itself, because if someone else has accesses to the same CA Root Certificate, you can be cheated - without the corresponding web browser issuing a warning.
This is especially important if you use a Shared Proxy Recorder or the Desktop Companion application. This means that you should never use such a web browser for financial-critical transactions such as e-banking - or for logging into personal websites, as long as a proxy recorder’s CA root certificate is installed in the browser. Only after removing the CA root certificate from the browser is it safe again.
This security problem is not so critical if you operate your own HTTP/S Remote Proxy Recorder (or have us operate it). But even in this case, you could theoretically be cheated by your team members.
So the most secure way is to remove the proxy recorder’s CA root certificate from the web browser as soon as your recording is done.
Once you have Imported the Proxy Recorder CA Root Certificate into the Web Browser and have installed the ‘RealLoad Test Recorder’ browser extension you are ready to Record Web Surfing Sessions and convert them into RealLoad Tests.
This browser extension will ask for the RealLoad proxy configurations, then automatically set Proxy in the browser. Using the extension user can clear cache, start recording, stop recording, clear recording and add page breaks while recording the user journeys in the browser.
Before you start installing the browser extension, Please make sure that you have already followed the steps mentioned in the doc HTTP/S Remote Proxy Recorder) , Registering a Proxy Recorder at the Portal and Import the Proxy Server CA Root Certificate.
Please open the link https://chrome.google.com/webstore/detail/mlindhmkpdadnkdoicbmijgdecpbioai/ in Chrome and Add to Chrome.

After adding the extension to Chrome, the next step will be setting the proxy details for recording in the extension options. In order to do that first we need to copy the proxy configuration data from the RealLoad portal https://portal.realload.com/ like below (under the HTTP/S Remote Proxy Recorder screen).


Once you have entered all the necessary RealLoad proxy details and save, you are ready to use the Browser Recorder extension for Chrome

Now you can go ahead and record your browser sessions by pressing Start Recording, You can add page breaks while recording by adding the page break name and press icon marked in the below screenshot.

Once you are done with your recording, you can press Stop Recording, which will revert the configured RealLoad Proxy to the Browser Automatic Proxy.

Now when you go to portal https://portal.realload.com/, you can see the recordings under the configured HTTP/S Remote Proxy Recorder screen.
The same steps are described below for the extension for Firefox.
Please open the link https://addons.mozilla.org/en-US/firefox/addon/realload-test-recorder/ in Firefox and Add to Firefox. Please make sure that you have checked the option “Allow this extension to run in Private Windows” during the installation.

After adding the add-ons to the firefox, the next step will be setting the proxy details for recording in the add-on preferences like below.

Once you have entered all the necessary RealLoad proxy details and save, you are ready to use the Browser Recorder extension for Firefox.

Now you can go ahead and record your browser sessions by pressing Start Recording, You can add page breaks while recording by adding the page break name and press icon marked in the below screenshot.

Once you are done with your recording, you can press Stop Recording, which will revert the configured RealLoad Proxy to the Browser Automatic Proxy.

Now when you go to portal https://portal.realload.com/, you can see the recordings under the configured HTTP/S Remote Proxy Recorder screen.
The Desktop Companion is a small application that allows you to manage some features related to the Real Load Platform.
In particular the desktop companion allows you to:

See sections below to learn more about the Desktop Companion.
Before running the Desktop Companion make sure you satisfy the following pre-requisites:
The Desktop Companion is a Java application currently delivered as a .jar file. At this stage there is no full installer for the application, which means that as a pre-requisite to run the application you’ll need to install a Java 11 JRE.
While it should run on any systems that support Java 11 and FXML, it was only tested on the following platforms:
| Operating System | JRE 11 Vendor and Build | JRE download link | Comments |
|---|---|---|---|
| Windows 10 | Microsoft “11.0.11” 2021-04-20 | https://docs.microsoft.com/en-au/java/openjdk/download | |
| Windows 11 | Microsoft | https://docs.microsoft.com/en-au/java/openjdk/download | |
| Apple OS X | Microsoft “build 11.0.13+8-LTS” | https://docs.microsoft.com/en-au/java/openjdk/download |
In order to use the AWS integration features, you’ll need to prepare Security Credentials with AWS IAM.
Seach for “IAM” in the AWS search bar and click on “Users”:

Then add a new user:

Enter a suitable user name and select “Access key” as the AWS credential type.

On the next page set an appropriate policy for the user. Usin the “AmazonEC2FullAccess” provides sufficinet permissions.

Skip the “Add tags” screen and go to the “Review” screen and click on “Create user”. Make sure the permissions you’ve assigned to the user appear on this screen.

Finally take a note of the Access Key ID and Secret Access Key as thess need to be configured in the Real Load Desktop Companion.
In order to register with the Real Load portal the AWS EC2 instances you’ve launched, the Desktop Companion requires that you configure an authentication token.
To create an authentication token proceed as follows:
Login to the Real Load Portal and click on the User -> API Authenticaiton Tokens menu.

Then click on the “Add API Authentication Tokens” button and enter a suitable purpose description. Optionally you can restrict the src IP address from where this token can be used.

Take note of the authentication Token Value as you’ll need to configure it in the Desktop Companion.
The full installer includes a JRE as well as the Desktop Companion application itself. This is the preferred method of deploying the application, as it avoids issues that might occur because of JRE customization, etc…
Additionally the application can be started from the Windows start menu, as any other application.
The latest version of the full installer can be downloaded from here:
You can download the latest version of the Desktop Companion as an executable .jar file from here: https://download.realload.com/desktop_companion/latest
There is no installer to be executed, the application can be launched by double clicking on the .jar file. If that doesn’t work, consider launching from the command line.
If you’ve only got one JDK/JRE version installed on your Windows computer then it’s very likely that .jar files are associated with the correct JRE. In that case you should be able to launch the application by double clicking on the .jar file.
If the application doesn’t start it’s possible the .jar extensions is associated with the incorrect JRE or another application altogether. You can try to right click on the .jar file and the “Open with” from the context menu.
Then selecte the OpenJRE launcher:

… or alternatively navigate to the JRE 11 binary, as shown in this screenshot:

Similarly on Windows 11:
 s
s
If the application doesn’t start, consider starting it from the command line as explained below.
Open a Terminal window. First validate that the java binary in your path is a JRE 11 binary by running this command:
java -version
The output should indicate you’re running a JRE 11 binary, as shown here:

If the version of the JRE is 11 then you can run the following command from the folder where the Desktop Companion .jar file was downloaded:
java.exe -jar .\RealLoadCompanionFXML-0.1.jar
If you only have JRE 11 installed on your Mac, you should be able to launch the application simply by double clicking on its icon:

Alternatively right-click on the icon and “Opne With” Jar Launcher.
If this doesn’t work, refer below on how to launch from the command line.
Open a Terminal window. First validate that the java binary in your path is a JRE 11 binary by running this command:
java -version
The output should indicate you’re running a JRE 11 binary, as shown here:

If a different JRE version is returned (like for example a JRE 8 binary) then you’ll need to specify the full path to the java 11 command. For example, assuming you installed the Microsoft OpenJDK 11, you would typically find it at this location:
/Library/Java/JavaVirtualMachines/microsoft-11.jdk/Contents/Home/bin/java
To run the Desktop Companion, assuming the .jar file is present in the current directory, run the following command from a Terminal window:
/Library/Java/JavaVirtualMachines/microsoft-11.jdk/Contents/Home/bin/java -jar RealLoadCompanionFXML-0.1.jar
Various application settings are configurable in the File -> Settings menu.

Default HAR input folder: Location where to look for .har (HTTP Archives) files by default. This should be the location where your browser writes files to.
Default export folder: This is the location where Real Load HTTP test scripts will be exported to in JSON format.
Agent Secret: The Measuring Agent secret to authenticate connections from the Real Load Portal to the Cloud Agent instance (AWS EC2 and Azure instances in future).
Portal URL: The endpoint of the Real Load portal User API. Unless you have an on-premise installation, use the default value https://portal.realload.com/RemoteUserAPI
Authentication Token: Enter here the authentication token that was generated by the Portal as part of the pre-requisites steps. Click on the “Test” button to test the API token.
Refresh Interval: How frequently should the list of Measuring Agents registered with the Real Cloud portal be refreshed. Any value 60 seconds or lower indicates no background refresh, you’ll need to manually trigger a refresh via context menu. By default set to 61 seconds (background refresh enabled).

AWS Access Key: Paste the AWS Access Key that was obained as part of the preparation steps.
Secret Access Key: Paster the AWS Secret Access key that was obained as part of the preparation steps. Use the “Test” button to validate the credentials.
Preferred Instance Type: The EC2 instance type to use when launching a new Mesauring Agent instance.
AWS EC2 Refresh Interval: How frequently should the list of AWS EC2 instances be refreshed. Any value 60 seconds or lower indicates no background refresh, you’ll need to manually trigger a refresh via context menu. By default set to 61 seconds (background refresh enabled).
My AWS Regions: Select the AWS regions you commonly use. To select multiple regions hold the CTRL key while selecting.

Proxy Port: The TCP port on the local machine that will listen for incoming proxy connections. You’ll need to configure this port as the HTTP proxy in your browser.
Export CA Certificate: This exports the CA certificate used by reverse proxy to sign SSL certificates. The exported CA should be added as a trusted CA to the browser you’re planning to use to record HTTP requests.
The next settings should be left to default values, unless there are specific reasons for changing them.
To import an HTTP Archive generate by a browser use the corresponding option in the file menu and select the relevant .har file. All requests present in the file will appear in the editor tab.
You can export your test script to a Real Load JSON session file by selecting the corresponding option in the file menu. The file will be saved in the folder you select.
You’ll then need to manually upload the file to a Resource Set in the Real Load Portal using the upload function.
Test scripts can be directly uploaded to the Real Load Portal via the “Export session to portal…” menu. You’ll need to select the resource set to save the load test to:

You have 2 options:
In the request editor tab you’ll be able to perform some basic editing of the requests imported from an HAR file or recorded by the proxy recorder.
For more complex editing please use the HTTP wizard in the Real Cloud portal after uploading your test script there.
The Editor tab is split in 3 main parts:

You can mark requestes in the main editor window by clicking on them. Hold the ctrl keyty to mark multiple request or use the shift key to mark a range of requests.
Once marked you can delete the requests by right-clicking on a marked request and selecting “Delete selected” from the context menu:

To add a time delay (currently hardcoded to 1 second) before or after a request, select the relevant context menu item while hovering over a request.
Time delays rows appear as requests of type “T” in the main editor window:

In order to bulk select all requests belonging to specific domains select one or more domains (by holding the CTRL key). This will select corresponding requests in the requests list which can then be easilly deleted.

It is also possible to directly delete requests belonging to one or multiple domains using the context menu.
The Measuring Agents tab allows you to manage Cloud Based (… currently AWS) Measuring Agents. This section of the application will be of most use if you configured AWS credentials in the preferences section of the application.
If no AWS credentials are configured, you won’t be able to start and terminate AWS instances.
In the left pane you’ll see a list of available AWS AMIs. You can further filter the list of AMIs by selecting a specific version and/or by selecteing an AWS region.

To launch an new EC2 instance right-click on the relevant AMI and select “Launch”. A screen to confirm the launch will be displayed. Confirm by clicking on the “Launch” button.
When launching an instance in an AWS EC2 region that is not yet part of your “My Regions” list, the region will be automatically added to the list.
Launching a new instaance will automatically trigger a refresh of the AWS Measuring Agents list. It might take a few second for the list to update and the new instance to be reflected in it.

Then confirm the launch action:

After launching an instance go to the top right part of the window listing the running instances and right click on “Refresh”. This will retrieve all running EC2 instances from the preferred AWS regions and display them in the table.

To register an AWS instance with the Real Load Portal right-click on the instance and then select the “Register with portal” menu item. The instance ID will be used as the description in the Real Load Portal.

In the left bottom part of the window you’ll see the Measuring Agents currently registered on the Portal. To update the list right click and select the “Refresh” option.

In order to de-register an instance from the Portal right click on the instance name and select De-register.

To terminate an AWS EC2 instance right click on the instance name.

The Desktop Companion allows you to run the Proxy Recorder locally on your desktop. Recorded requests will then appear in the Editor tab. Refer to the Proxy Recorder documentation for further information on how it works.
There are two main sections in this chapter:
You’ll have to configure the port the Real Load Proxy listens on (default: 18080) in your browser. We recommend to use a browser that allows you to configure proxy settings independently from the Operating System proxy settings. FireFox is a good candidate for this and we’ve documented its configuration in this section.
For the browser to trust SSL certificates issued by the Recording Proxy, you’ll need to import the Proxy’s CA certificate as follows:


Then click on the “Auhtorities” tab, “Import” button and select the “RecProxyCert.cer” that you’ve just exported from the Desktop Companion.

Make sure you trust the certificate to identify websites:

In the FireFox “Settings” and scroll to the bottom of the page where “Network Settings” are located . The below window should be displayed and configure the Port to be 18080 for both HTTP and HTTPS. Configure the host and port as shown in the below screenshot. Also tick the “Also use this proxy for HTTPS”.

Navigate to any SSL enabled page. You shouldn’t see any warnings about untrusted SSL certificates beings used.
If you check the certificate of the site you’re visiting, the issuer should be “Real Load Pty Ltd”, as shown in this screenshot.

To start the recording process go to the Proxy Recorder tab and click on the “Start Recorder” button. Note that when the recording process is started, previous Proxy Recorder logs are purged.

To stop the recording process clik on the “Stop Recorder” button. Then navigate to the “Editor” window and you should see all recorded requests as in this example:

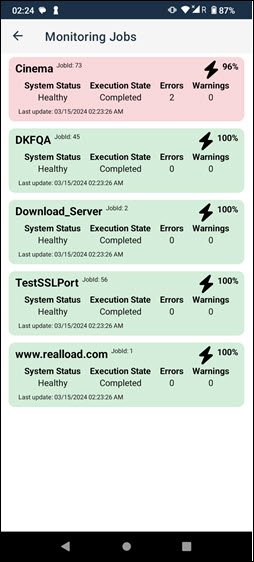 The Mobile Companion is a small Android App that displays a simplified view of the Synthetic Monitoring Dashboard and can receive and display Synthetic Monitoring Alert Notifications.
![]()

In order to receive notifications at any time, we recommend that you switch off the App option “Pause app activity if unused”.


When you start the App for the first time, you have to log in to the portal server. Enter the same username and password as for a normal portal server sign-in.

In the background, during the login process on the portal server, a so-called “API Authentication Token” is generated with the purpose “RealLoad Mobile App” which is permanently stored in the Mobile Companion App.
Portal Server:

After you have installed and configured the App, you should test the receipt of push notifications.


If Synthetic Monitoring warnings or errors were detected, the background color changes to yellow or red:


When you set up a mobile device as an alert device for the first time, we recommend that you double check whether all alert notifications have been received. Proceed as follow:


Tip: You can get the unique Device Id at any time by clicking “Settings” at the bottom of the App.

Regression testing is supported by Real Load using “Test Job Templates” and “Test Suites”.
Features of Real Load Test Suites:
This seems a bit complicated at first glance. However, as you will see, creating and running test suites is fairly easy.
Test job templates can be created by clicking ‘Save as Template’ in the dropdown menu of any load test job:

You can freely choose the name of the template, but it must be unique.

The template is then created. For verification purposes, the test job properties are displayed which you can also change here.

The list of all templates will then be displayed. Here you can delete, clone and modify individual templates and you can create also new load test jobs from a template.

As soon as one or more test job templates are created, you can add a new test suite.


You can freely choose the name of the test suite, but it must be unique.

After that the test suite is created and the “Test Suite Editor” is automatically invoked.
It is recommended that you configure a measuring agent or cluster on which the test suite runs will be executed so that you are not asked about it every time you start a test suite run.

Only “Execution Groups” can be defined at the main level of a test suite. This means that you have first to add one or more execution groups to the test sequence.
At the top right of the editor area you can configure the “Main Execution Order”, which controls whether the execution groups at the main level are executed one after the other (= sequential ) or concurrently (= parallel).


Here you can specify on which measuring agent or cluster the execution group will be executed, whereby the default option “inherit from parent” is recommended. By setting the “Execution Order” you can determine whether the elements of the execution group are executed sequentially or in parallel.
Note: Execution groups can also be nested, which means that an execution group can contain several sub-execution groups, which can then contain sub-sub execution groups. The advantage of nesting execution groups is, among other things, that the measured data of the executed the test jobs are presented in aggregated form at the level of each execution group.


Finally, click the icon at the top left corner to return to the Test Suites Dashboard.
A test suite “run” can be triggered either interactively or via the Remote User API.
To start a “run” click on the green icon of the test suite - which means that all test jobs of the test suite are executed.

In the upper area of the green window, summarized/aggregated measurement results over all executed test jobs are displayed.
In the left area of the green window, the progress of the of the test suite execution is displayed in real time, whereby the measured values of the currently executed (load) test jobs are updated every 4 seconds.

Multiple test suites can be executed concurrently, but the same test suite cannot be executed twice at the same time. Note that closing the green window will not abort the execution of the test suite “run”.
Tip: If a load test job of a test suite takes several minutes to execute, you can also view the detailed statistics of the load test job in a second Web Browser window in the Real Time View. All you have to do is select the Real Time View in the second browser window.

After a test suite run is completed you can click on “Display Result”.


Test Suite Run Results are always historical data, whereby the execution groups and the test jobs are painted as they were at the time of execution.
In the upper area summarized/aggregated measurement results over all executed test jobs are displayed.
Clicking on the chart icon of a test job displays the “Test Result Details”. By clicking the file icon, you can view the contents of the test job output files.

The summarized/aggregated measurement results of the test suite runs can be compared across all or a selection of runs.


Furthermore, the measurement results of the individual test jobs can be compared across all or a selection of runs.


It is an API Service which holds all the API requests, which can be used to store the test data in table formats in a Database, which can be consumed/produced by both load test and synthetic monitoring tests. So it acts like a Test Data database where multiple scripts can consume common test data.
Currently, the Tests need Plugins to communicate with the Table Server API, but in near future we will come up with a solution where performance Engineers can write inline javascript in the test to communicate with the Table Server APIs.
Below are the API Requests that Table Server supports
  curl -k --location --request POST 'https://{{tableserverURL}}:8084/Api' \
  --header 'Content-Type: application/json' \
  --data-raw '{
  "apiAuthToken": "{{apiAuthToken}}",
  "action": "createNewTable",
  "tableName": "Products",
  "columnNamesAndValues": [
        {
            "ProductGroup": "Icecream",
            "ProductName": "Vanilla"
        },
        {
            "ProductGroup": "Pizza",
            "ProductName": "Margareta"
        }
    ]
  }'
  curl -k --location --request POST 'https://{{tableserverURL}}:8084/Api' \
  --header 'Content-Type: application/json' \
  --data-raw '{
  "apiAuthToken": "{{apiAuthToken}}",
  "action": "createNewTableFromCSVFile",
  "uploadFileName": "Products.csv",
  "delimiter": ",",
  "uploadFileDataB64": "UHJvZHVjdEdyb3VwLFByb2R1Y3ROYW1lLFByaWNlDURyaW5rcyxDb2NhQ29sYSwxMApEcmlua3MsUGVwc2ksNwpEcmlua3MsN1VwLDgKRHJpbmtzLEZhbnRhLDkKUGl6emEsTWFyZ2FyZXRhLDEwDQ=="
  }'
  curl -k --location --request POST 'https://{{tableserverURL}}:8084/Api' \
  --header 'Content-Type: application/json' \
  --data-raw '{
  "apiAuthToken": "{{apiAuthToken}}",
  "action": "getAllTables",
  "includeColumns": true
  }'
  curl -k --location --request POST 'https://{{tableserverURL}}:8084/Api' \
  --header 'Content-Type: application/json' \
  --data-raw '{
  "apiAuthToken": "{{apiAuthToken}}",
  "action": "insertColumn",
  "table": "Products",
  "column": "ProductGroup",
  "value": "Sweets"
  }'
  curl -k --location --request POST 'https://{{tableserverURL}}:8084/Api' \
  --header 'Content-Type: application/json' \
  --data-raw '{
  "apiAuthToken": "{{apiAuthToken}}",
  "action": "retrieveColumn",
  "table": "Products",
  "column": "ProductName"
  }'
Update a single test data.
curl -k --location --request POST 'https://{{tableserverURL}}:8084/Api' \
--header 'Content-Type: application/json' \
--data-raw '{
"apiAuthToken": "{{apiAuthToken}}",
"action": "updateColumn",
"table": "Products",
"column": "ProductGroup",
"value": "Fruits",
"rowIndex":1
}'
Create multiple test data.
  curl -k --location --request POST 'https://{{tableserverURL}}:8084/Api' \
  --header 'Content-Type: application/json' \
  --data-raw '{
  "apiAuthToken": "{{apiAuthToken}}",
  "action": "insertRow",
  "table": "Products",
  "columnsAndValues": [
        {
            "ProductGroup": "Vegetables",
            "ProductName": "Carrot"
        }
    ]
  }'
  curl --location --request POST 'https://{{tableserverURL}}:8084/Api' \
  --header 'Content-Type: application/json' \
  --data-raw '{
  "apiAuthToken": "{{apiAuthToken}}",
  "action": "retrieveRow",
  "table": "Products",
  "columns": [
            "ProductGroup",
            "ProductName"
    ]
  }'
  curl -k --location --request POST 'https://{{tableserverURL}}:8084/Api' \
  --header 'Content-Type: application/json' \
  --data-raw '{
  "apiAuthToken": "{{apiAuthToken}}",
  "action": "queryTable",
  "table": "Products",
  "columnNamesAndValues": [
        {
            "ProductGroup": "Vegetables",
            "ProductName": "Carrot"
        }
    ]
  }'
 curl --location --request POST 'https://{{tableserverURL}}:8084/Api' \
 --header 'Content-Type: application/json' \
 --data-raw '{
 "apiAuthToken": "{{apiAuthToken}}",
 "action": "exportTableToCSV",
 "table": "Products"
 }'
This document explains:
The All Purpose Interface is the core of the product.
The architecture and the provided components that support this interface are referred as the Real Load Platform, which is optimized for performing load and stress tests with thousands of concurrent users.
This interface can be implemented by any programming language and regulates:
What requirements a script or program must comply in order to be executed by the Real Load Platform.
How the runtime behavior of the simulated users and the measured data of a script or program are reported to the Real Load Platform.
The great advantage of using the Real Load Platform is that only the basic functionality of a test has to be implemented. The powerful features of the Real Load Platform takes care of everything else, such as executing tests on remote systems and displaying the measured results in the form of diagrams, tables and statistics - in real time as well as final test result.
The product’s open architecture enables you to develop plug-ins, scripts and programs that measure anything that has numeric value - no matter which protocol is used!
The measured data are evaluated in real time and displayed as diagrams and lists. In addition to successfully measured values, also errors like timeouts or invalid response data can be collected and displayed in real time.
At least in theory, programs and scripts of any programming language can be executed, as long as such a program or script supports the All Purpose Interface.
In practice there are currently two options for integrating your own measurements into the Real Load Platform:
Write an HTTP Test Wizard Plug-In in Java that performs the measurement. This has the advantage that you only have to implement a subset of the “All Purpose Interface” yourself:
Such plug-ins can be developed quite quickly, as all other functions of the “All Purpose Interface” are already implemented by the HTTP Test Wizard.
Tip: An HTTP Test Wizard session can also only consist of plug-ins, i.e. you can “misuse” the HTTP Test Wizard to only carry out measurements that you have programmed yourself: Plug-In Example
Write a test program or from scratch. This can currently be programmed in Java or PowerShell (support for additional programming languages will be added in the future). This is more time-consuming, but has the advantage that you have more freedom in program development. In this case you have to implement all functions of the “All Purpose Interface”.
The All Purpose Interface must be implemented by all programs and scripts which are executed on the Real Load Platform. The interface is independent of any programming language and has only three requirements:
All of this seems a bit trivial, but has been chosen deliberately. So that the interface can support almost all programming languages.
Each executed program or script must support at least the following arguments:
Implementation Note: The test ends if either the Test Duration is elapsed or if Max Session Loops are reached for all simulated users. Currently executed sessions are not aborted.
In addition, the following arguments are optional, but also standardized:
| Argument | Java | PowerShell |
|---|---|---|
| Number of Users | -users number | -totalUsers number |
| Test Duration | -duration seconds | -inputTestDuration seconds |
| Ramp Up Time | -rampupTime seconds | -rampUpTime seconds |
| Max Session Loops | -maxLoops number | -inputMaxLoops number |
| Delay Per Session Loop | -delayPerLoop milliseconds | -inputDelayPerLoopMillis milliseconds |
| Data Output Directory | -dataOutputDir path | -dataOutDirectory path |
| Description | -description text | -description text |
| Debug Execution | -debugExec | -debugExecution |
| Debug Measuring | -debugData | -debugMeasuring |
For scripts which don’t support multiple threads the Real Load Platform starts for each simulated user a own operating system process per simulated user. On the other hand, for programs which support multiple threads, only one operating system process is started for all simulated users.
Scripts which are not able to run multiple threads must support the following additional generic command line argument:
| Argument | PowerShell |
|---|---|
| Executed User Number | -inputUserNo number |
Additional program and script specific arguments are supported by the Real Load Platform. Hoverer, their values are not validated by the platform.
During the execution of a test the Real Load Platform can create and delete at runtime additional control files in the Data Output Directory of a test job. The existence, and respectively the absence of such control files must be frequently checked by the running script or program, but not too often to avoid CPU and I/O overload. Rule of thumb: Multi-threaded programs should check the existence of such files every 5..10 seconds. Single-threaded scripts should check such files before executing a new session loop iteration.
The following control files are created or removed in the Data Output Directory by the Real Load Platform:
When a test job is started by the Real Load Platform on a Measuring Agent, then the Real Load Platform creates at first for each simulated user an empty data file in the Data Output Directory of the test job:
Data File: user_<Executed User Number>_statistics.out
Example: user_1_statistics.out, user_2_statistics.out, user_3_statistics.out, .. et cetera.
After that, the test script(s) or test program is started as operating system process. The test script or the test program has to write the current state of the simulated user and measured data to the corresponding Data File of the simulated user in JSON object format (append data to the file only – don’t create new files).
The Real Load Platform component Measuring Agent and the corresponding Data Collector are listening to these data files and interpret the measured data at real-time, line by line as JSON objects.

The following JSON Objects can be written to the Data Files:
| JSON Object | Description |
|---|---|
| Declare Statistic | Declare a new statistic |
| Register Execute Start | Registers the start of a user |
| Register Execute Suspend | Registers that the execution of a user is suspended |
| Register Execute Resume | Registers that the execution of a user is resumed |
| Register Execute End | Registers that a user has ended |
| Register Loop Start | Registers that a user has started a session loop iteration |
| Register Loop Passed | Registers that a session loop iteration of a user has passed |
| Register Loop Failed | Registers that a session loop iteration of a user has failed |
| Register Sample Start | Statistic-type sample-event-time-chart: Registers the start of measuring a sample |
| Add Sample Long | Statistic-type sample-event-time-chart: Registers that a sample has measured and report the value |
| Add Sample Error | Statistic-type sample-event-time-chart: Registers that the measuring of a sample has failed |
| Add Counter Long | Statistic-type cumulative-counter-long: Add a positive delta value to the counter |
| Add Average Delta And Current Value | Statistic-type average-and-current-value: Add delta values to the average and set the current value |
| Add Efficiency Ratio Delta | Statistic-type efficiency-ratio-percent: Add efficiency ratio delta values |
| Add Throughput Delta | Statistic-type throughput-time-chart: Add a delta value to a throughput |
| Add Error | Add an error the test result |
| Add Test Result Annotation Exec Event | Add an annotation event to the test result |
Note that the data of each JSON object must be written as a single line which end with a \r\n line terminator.


Before the measurement of data begins, the corresponding statistics must be declared at runtime. Each declared statistic must have a unique ID. Multiple declarations with the same ID are crossed out by the platform.
Currently 5 types of statistics are supported:

It’s also supported to declare new statistics at any time during test execution, but the statistics must be declared first, before the measured data are added.
{
  "$schema": "http://json-schema.org/draft/2019-09/schema",
  "title": "DeclareStatistic",
  "type": "object",
  "required": ["subject", "statistic-id", "statistic-type", "statistic-title"],
  "properties": {
    "subject": {
      "type": "string",
      "description": "Always 'declare-statistic'"
    },
    "statistic-id": {
      "type": "integer",
      "description": "Unique statistic id"
    },
    "statistic-type": {
      "type": "string",
      "description": "'sample-event-time-chart' or 'cumulative-counter-long' or 'average-and-current-value' or 'efficiency-ratio-percent' or 'throughput-time-chart'"
    },
    "statistic-title": {
      "type": "string",
      "description": "Statistic title"
    },
    "statistic-subtitle": {
      "type": "string",
      "description": "Statistic subtitle | only supported by 'sample-event-time-chart'"
    },
    "y-axis-title": {
      "type": "string",
      "description": "Y-Axis title | only supported by 'sample-event-time-chart'. Example: 'Response Time'"
    },
    "unit-text": {
      "type": "string",
      "description": "Text of measured unit. Example: 'ms'"
    },
    "sort-position": {
      "type": "integer",
      "description": "The UI sort position"
    },
    "add-to-summary-statistic": {
      "type": "boolean",
      "description": "If true = add the number of measured and failed samples to the summary statistic | only supported by 'sample-event-time-chart'. Note: Synthetic measured data like Measurement Groups or Delay Times should not be added to the summary statistic"
    },
    "background-color": {
      "type": "string",
      "description": "The background color either as #hex-triplet or as bootstrap css class name, or an empty string = no special background color. Examples: '#cad9fa', 'table-info'"
    }
  }
}

Example:
{
  "subject":"declare-statistic",
  "statistic-id":1,
  "statistictype":"sample-event-time-chart",
  "statistic-title":"GET http://192.168.0.111/",
  "statistic-subtitle":"",
  "y-axis-title":"Response Time",
  "unit-text":"ms",
  "sort-position":1,
  "add-to-summarystatistic":true,
  "background-color":""
}
After the statistics are declared then the activities of the simulated users can be started. Each simulated user must report the following changes of the current user-state:
{
  "$schema": "http://json-schema.org/draft/2019-09/schema",
  "title": "RegisterExecuteStart",
  "type": "object",
  "required": ["subject", "timestamp"],
  "properties": {
    "subject": {
      "type": "string",
      "description": "Always 'register-execute-start'"
    },
    "timestamp": {
      "type": "integer",
      "description": "Unix-like time stamp"
    }
  }
}

Example:
{"subject":"register-execute-start","timestamp":1596219816129}
{
  "$schema": "http://json-schema.org/draft/2019-09/schema",
  "title": "RegisterExecuteSuspend",
  "type": "object",
  "required": ["subject", "timestamp"],
  "properties": {
    "subject": {
      "type": "string",
      "description": "Always 'register-execute-suspend'"
    },
    "timestamp": {
      "type": "integer",
      "description": "Unix-like time stamp"
    }
  }
}

Example:
{"subject":"register-execute-suspend","timestamp":1596219816129}
{
  "$schema": "http://json-schema.org/draft/2019-09/schema",
  "title": "RegisterExecuteResume",
  "type": "object",
  "required": ["subject", "timestamp"],
  "properties": {
    "subject": {
      "type": "string",
      "description": "Always 'register-execute-resume'"
    },
    "timestamp": {
      "type": "integer",
      "description": "Unix-like time stamp"
    }
  }
}

Example:
{"subject":"register-execute-resume","timestamp":1596219816129}
{
  "$schema": "http://json-schema.org/draft/2019-09/schema",
  "title": "RegisterExecuteEnd",
  "type": "object",
  "required": ["subject", "timestamp"],
  "properties": {
    "subject": {
      "type": "string",
      "description": "Always 'register-execute-end'"
    },
    "timestamp": {
      "type": "integer",
      "description": "Unix-like time stamp"
    }
  }
}

Example:
{"subject":"register-execute-end","timestamp":1596219816129}
Once a simulated user has started its activity it measures the data in so called ‘session loops’. Each simulated must report when a session loop iteration starts and ends:
{
  "$schema": "http://json-schema.org/draft/2019-09/schema",
  "title": "RegisterLoopStart",
  "type": "object",
  "required": ["subject", "timestamp"],
  "properties": {
    "subject": {
      "type": "string",
      "description": "Always 'register-loop-start'"
    },
    "timestamp": {
      "type": "integer",
      "description": "Unix-like time stamp"
    }
  }
}

Example:
{"subject":"register-loop-start","timestamp":1596219816129}
{
  "$schema": "http://json-schema.org/draft/2019-09/schema",
  "title": "RegisterLoopPassed",
  "type": "object",
  "required": ["subject", "loop-time", "timestamp"],
  "properties": {
    "subject": {
      "type": "string",
      "description": "Always 'register-loop-passed'"
    },
    "loop-time": {
      "type": "integer",
      "description": "The time it takes to execute the loop in milliseconds"
    },
    "timestamp": {
      "type": "integer",
      "description": "Unix-like time stamp"
    }
  }
}

Example:
{"subject":"register-loop-passed","loop-time":1451, "timestamp":1596219816129}
{
  "$schema": "http://json-schema.org/draft/2019-09/schema",
  "title": "RegisterLoopFailed",
  "type": "object",
  "required": ["subject", "timestamp"],
  "properties": {
    "subject": {
      "type": "string",
      "description": "Always 'register-loop-failed'"
    },
    "timestamp": {
      "type": "integer",
      "description": "Unix-like time stamp"
    }
  }
}

Example:
{"subject":"register-loop-failed","timestamp":1596219816129}
Within a session loop iteration the samples of the declared statistics are measured. For sample-event-time-chart statistics the simulated user must report when the measuring of a sample starts and ends:
{
  "$schema": "http://json-schema.org/draft/2019-09/schema",
  "title": "RegisterSampleStart",
  "type": "object",
  "required": ["subject", "statistic-id", "timestamp"],
  "properties": {
    "subject": {
      "type": "string",
      "description": "Always 'register-sample-start'"
    },
    "statistic-id": {
      "type": "integer",
      "description": "The unique statistic id"
    },
    "timestamp": {
      "type": "integer",
      "description": "Unix-like time stamp"
    }
  }
}

Example:
{"subject":"register-sample-start","statisticid":2,"timestamp":1596219816165}
{
  "$schema": "http://json-schema.org/draft/2019-09/schema",
  "title": "AddSampleLong",
  "type": "object",
  "required": ["subject", "statistic-id", "value", "timestamp"],
  "properties": {
    "subject": {
      "type": "string",
      "description": "Always 'add-sample-long'"
    },
    "statistic-id": {
      "type": "integer",
      "description": "The unique statistic id"
    },
    "value": {
      "type": "integer",
      "description": "The measured value"
    },
    "timestamp": {
      "type": "integer",
      "description": "Unix-like time stamp"
    }
  }
}

Example:
{"subject":"add-sample-long","statisticid":2,"value":105,"timestamp":1596219842468}
{
  "$schema": "http://json-schema.org/draft/2019-09/schema",
  "title": "AddSampleError",
  "type": "object",
  "required": ["subject", "statistic-id", "error-subject", "error-severity",
  "timestamp"],
  "properties": {
    "subject": {
      "type": "string",
      "description": "Always 'add-sample-error'"
    },
    "statistic-id": {
      "type": "integer",
      "description": "The unique statistic id"
    },
    "error-subject": {
      "type": "string",
      "description": "The subject or title of the error"
    },
    "error-severity": {
      "type": "string",
      "description": "'warning' or 'error' or 'fatal'"
    },
    "error-type": {
      "type": "string",
      "description": "The type of the error. Errors which contains the same error
    type can be grouped."
    },
    "error-log": {
      "type": "string",
      "description": "The error log. Multiple lines are supported by adding \r\n line terminators."
    },
    "error-context": {
      "type": "string",
      "description": "Context information about the condition under which the error occurred. Multiple lines are supported by adding \r\n line terminators."
    },
    "timestamp": {
      "type": "integer",
      "description": "Unix-like time stamp"
    }
  }
}

Example:
{
  "subject":"add-sample-error",
  "statistic-id":2,
  "error-subject":"Connection refused (Connection refused)",
  "error-severity":"error",
  "error-type":"java.net.ConnectException",
  "error-log":"2020-08-01 21:24:51.662 | main-HTTPClientProcessing[3] | INFO | GET http://192.168.0.111/\r\n2020-08-01 21:24:51.670 | main-HTTPClientProcessing[3] | ERROR | Failed to open or reuse connection to 192.168.0.111:80 |
 java.net.ConnectException: Connection refused (Connection refused)\r\n",
  "error-context":"HTTP Request Header\r\nhttp://192.168.0.111/\r\nGET / HTTP/1.1\r\nHost: 192.168.0.111\r\nConnection: keep-alive\r\nAccept: */*\r\nAccept-Encoding: gzip, deflate\r\n",
  "timestamp":1596309891672
}
Note about the error-severity :
Implementation note: After an error has occurred, the simulated user should wait at least 100 milliseconds before continuing his activities. This is to prevent that within a few seconds several thousand errors are measured and reported to the UI
For cumulative-counter-long statistics there is no such 2-step mechanism as for ‘sample-event-time-chart’ statistics. The value can simple increased by reporting a Add Counter Long object.
{
  "$schema": "http://json-schema.org/draft/2019-09/schema",
  "title": "AddCounterLong",
  "type": "object",
  "required": ["subject", "statistic-id", "value"],
  "properties": {
    "subject": {
      "type": "string",
      "description": "Always 'add-counter-long'"
    },
    "statistic-id": {
      "type": "integer",
      "description": "The unique statistic id"
    },
    "value": {
      "type": "integer",
      "description": "The value to increment"
    }
  }
}

Example:
{"subject":"add-counter-long","statistic-id":10,"value":2111}
To update a average-and-current-value statistic the delta (difference) values of the cumulated sum and the delta (difference) of the cumulated number of values has to be reported. The platform calculates then the average value by dividing the cumulated sum by the cumulated number of values. In addition, the last measured value must also be reported.
{
  "$schema": "http://json-schema.org/draft/2019-09/schema",
  "title": "AddAverageDeltaAndCurrentValue",
  "type": "object",
  "required": ["subject", "statistic-id", "sumValuesDelta", "numValuesDelta", "currentValue", "currentValueTimestamp"],
  "properties": {
    "subject": {
      "type": "string",
      "description": "Always 'add-average-delta-and-current-value'"
    },
    "statistic-id": {
      "type": "integer",
      "description": "The unique statistic id"
    },
    "sumValuesDelta": {
      "type": "integer",
      "description": "The sum of delta values to add to the average"
    },
    "numValuesDelta": {
      "type": "integer",
      "description": "The number of delta values to add to the average"
    },
    "currentValue": {
      "type": "integer",
      "description": "The current value, or -1 if no such data is available"
    },
    "currentValueTimestamp": {
      "type": "integer",
      "description": "The Unix-like timestamp of the current value, or -1 if no such data is available"
    }
  }
}

Example:
{
  "subject":"add-average-delta-and-current-value",
  "statistic-id":100005,
  "sumValuesDelta":6302,
  "numValuesDelta":22,
  "currentValue":272,
  "currentValueTimestamp":1634401774374
}
To update a efficiency-ratio-percent statistic, the delta (difference) of the number of efficient performed procedures and the delta (difference) of the number of inefficient performed procedures has to be reported.
{
  "$schema": "http://json-schema.org/draft/2019-09/schema",
  "title": "AddEfficiencyRatioDelta",
  "type": "object",
  "required": ["subject", "statistic-id", "efficiencyDeltaValue", "inefficiencyDeltaValue"],
  "properties": {
    "subject": {
      "type": "string",
      "description": "Always 'add-efficiency-ratio-delta'"
    },
    "statistic-id": {
      "type": "integer",
      "description": "The unique statistic id"
    },
    "efficiencyDeltaValue": {
      "type": "integer",
      "description": "The number of efficient performed procedures to add"
    },
    "inefficiencyDeltaValue": {
      "type": "integer",
      "description": "The number of inefficient performed procedures to add"
    }
  }
}

Example:
{
  "subject":"add-efficiency-ratio-delta",
  "statistic-id":100006,
  "efficiencyDeltaValue":6,
  "inefficiencyDeltaValue":22
}
To update a throughput-time-chart statistic, the delta (difference) value from a last absolute, cumulated value to the current cumulated value has to be reported, whereby the current time stamp is included in the calculation.
Although this type of statistic always has the unit throughput per second, a measured delta (difference) value can be reported at any time.
{
  "$schema": "http://json-schema.org/draft/2019-09/schema",
  "title": "AddThroughputDelta",
  "type": "object",
  "required": ["subject", "statistic-id", "delta-value", "timestamp"],
  "properties": {
    "subject": {
      "type": "string",
      "description": "Always 'add-throughput-delta'"
    },
    "statistic-id": {
      "type": "integer",
      "description": "The unique statistic id"
    },
    "delta-value": {
      "type": "number",
      "description": "the delta (difference) value"
    },
    "timestamp": {
      "type": "integer",
      "description": "The Unix-like timestamp of the delta (difference) value"
    }
  }
}

Example:
{
  "subject":"add-throughput-delta",
  "statistic-id":100003,
  "delta-value":0.53612,
  "timestamp":1634401774410
}
Add an error to the test result.
{
  "$schema": "http://json-schema.org/draft/2019-09/schema",
  "title": "AddError",
  "type": "object",
  "required": ["subject", "statistic-id", "error-subject", "error-severity",
  "timestamp"],
  "properties": {
    "subject": {
      "type": "string",
      "description": "Always 'add-error'"
    },
    "statistic-id": {
      "type": "integer",
      "description": "The unique statistic id, or -1 if this error is not bound to any statistic"
    },
    "error-subject": {
      "type": "string",
      "description": "The subject or title of the error"
    },
    "error-severity": {
      "type": "string",
      "description": "'warning' or 'error' or 'fatal'"
    },
    "error-type": {
      "type": "string",
      "description": "The type of the error. Errors which contains the same error type can be grouped."
    },
    "error-log": {
      "type": "string",
      "description": "The error log. Multiple lines are supported by adding \r\n line terminators."
    },
    "error-context": {
      "type": "string",
      "description": "Context information about the condition under which the error occurred. Multiple lines are supported by adding \r\n line terminators."
    },
    "timestamp": {
      "type": "integer",
      "description": "Unix-like time stamp"
    }
  }
}

Example:
{
  "subject":"add-error",
  "statistic-id":-1,
  "error-subject":"Connection refused (Connection refused)",
  "error-severity":"error",
  "error-type":"java.net.ConnectException",
  "error-log":"2020-08-01 21:24:51.662 | main-HTTPClientProcessing[3] | INFO | GET http://192.168.0.111/\r\n2020-08-01 21:24:51.670 | main-HTTPClientProcessing[3] | ERROR | Failed to open or reuse connection to 192.168.0.111:80 |
 java.net.ConnectException: Connection refused (Connection refused)\r\n",
  "error-context":"HTTP Request Header\r\nhttp://192.168.0.111/\r\nGET / HTTP/1.1\r\nHost: 192.168.0.111\r\nConnection: keep-alive\r\nAccept: */*\r\nAccept-Encoding: gzip, deflate\r\n",
  "timestamp":1596309891672
}
Note: Do not use this error object for sample-event-time-chart(s).
Add an annotation event to the test result.
{
  "$schema": "http://json-schema.org/draft/2019-09/schema",
  "title": "AddTestResultAnnotationExecEvent",
  "type": "object",
  "required": ["subject", "event-id", "event-text", "timestamp"],
  "properties": {
    "subject": {
      "type": "string",
      "description": "Always 'add-test-result-annotation-exec-event'"
    },
    "event-id": {
      "type": "integer",
      "description": "The event id, valid range: -1 .. -999999"
    },
    "event-text": {
      "type": "string",
      "description": "the event text"
    },
    "timestamp": {
      "type": "integer",
      "description": "The Unix-like timestamp of the event"
    }
  }
}

Example:
{
  "subject":"add-test-result-annotation-exec-event",
  "event-id":-1,
  "event-text":"Too many errors: Test job stopped by plug-in",
  "timestamp":1634401774410
}
Notes:
This plug-in “measures” a random value, and is executed in this example as the only part of an HTTP Test Wizard session.
The All Purpose Interface JSON objects are written using the corresponding methods of the com.dkfqs.tools.javatest.AbstractJavaTest class. This class is located in the JAR file com.dkfqs.tools.jar which is already predefined for all plug-ins.
import com.dkfqs.tools.javatest.AbstractJavaTest;
import com.dkfqs.tools.javatest.AbstractJavaTestPluginContext;
import com.dkfqs.tools.javatest.AbstractJavaTestPluginInterface;
import com.dkfqs.tools.javatest.AbstractJavaTestPluginSessionFailedException;
import com.dkfqs.tools.javatest.AbstractJavaTestPluginTestFailedException;
import com.dkfqs.tools.javatest.AbstractJavaTestPluginUserFailedException;
import com.dkfqs.tools.logging.LogAdapterInterface;
import java.util.ArrayList;
import java.util.List;
// add your imports here

/**
 * HTTP Test Wizard Plug-In 'All Purpose Interface Example'.
 * Plug-in Type: Normal Session Element Plug-In.
 * Created by 'DKF' at 24 Sep 2021 22:50:04
 * DKFQS 4.3.22
 */
@AbstractJavaTestPluginInterface.PluginResourceFiles(fileNames={"com.dkfqs.tools.jar"})
public class AllPurposeInterfaceExample implements AbstractJavaTestPluginInterface {
	private LogAdapterInterface log = null;

	private static final int STATISTIC_ID = 1000;
	private AbstractJavaTest javaTest = null;       // refrence to the generated test program

	/**
	 * Called by environment when the instance is created.
	 * @param log the log adapter
	 */
	@Override
	public void setLog(LogAdapterInterface log) {
		this.log = log;
	}

	/**
	 * On plug-in initialize. Called when the plug-in is initialized. <br>
	 * Depending on the initialization scope of the plug-in the following specific exceptions can be thrown:<ul>
	 * 	<li>Initialization scope <b>global:</b> AbstractJavaTestPluginTestFailedException</li>
	 * 	<li>Initialization scope <b>user:</b> AbstractJavaTestPluginTestFailedException, AbstractJavaTestPluginUserFailedException</li>
	 * 	<li>Initialization scope <b>session:</b> AbstractJavaTestPluginTestFailedException, AbstractJavaTestPluginUserFailedException, AbstractJavaTestPluginSessionFailedException</li>
	 * </ul>
	 * @param javaTest the reference to the executed test program, or null if no such information is available (in debugger environment)
	 * @param pluginContext the plug-in context
	 * @param inputValues the list of input values
	 * @return the list of output values
	 * @throws AbstractJavaTestPluginSessionFailedException if the plug-in signals that the 'user session' has to be aborted (abort current session - continue next session)
	 * @throws AbstractJavaTestPluginUserFailedException if the plug-in signals that the user has to be terminated
	 * @throws AbstractJavaTestPluginTestFailedException if the plug-in signals that the test has to be terminated
	 * @throws Exception if an error occurs in the implementation of this method
	 */
	@Override
	public List<String> onInitialize(AbstractJavaTest javaTest, AbstractJavaTestPluginContext pluginContext, List<String> inputValues) throws AbstractJavaTestPluginSessionFailedException, AbstractJavaTestPluginUserFailedException, AbstractJavaTestPluginTestFailedException, Exception {
		// log.message(log.LOG_INFO, "onInitialize(...)");

		// --- vvv --- start of specific onInitialize code --- vvv ---
		if (javaTest != null) {
		    this.javaTest = javaTest;

		    // declare the statistic
		    javaTest.declareStatistic(STATISTIC_ID,
            		                  AbstractJavaTest.STATISTIC_TYPE_SAMPLE_EVENT_TIME_CHART,
            		                  "My Measurement",
            		                  "",
            		                  "My Response Time",
            		                  "ms",
            		                  STATISTIC_ID,
            		                  true,
            		                  "");
		}
		// --- ^^^ --- end of specific onInitialize code --- ^^^ ---

		return new ArrayList<String>();		// no output values
	}

	/**
	 * On plug-in execute. Called when the plug-in is executed. <br>
	 * Depending on the execution scope of the plug-in the following specific exceptions can be thrown:<ul>
	 * 	<li>Initialization scope <b>global:</b> AbstractJavaTestPluginTestFailedException</li>
	 * 	<li>Initialization scope <b>user:</b> AbstractJavaTestPluginTestFailedException, AbstractJavaTestPluginUserFailedException</li>
	 * 	<li>Initialization scope <b>session:</b> AbstractJavaTestPluginTestFailedException, AbstractJavaTestPluginUserFailedException, AbstractJavaTestPluginSessionFailedException</li>
	 * </ul>
	 * @param pluginContext the plug-in context
	 * @param inputValues the list of input values
	 * @return the list of output values
	 * @throws AbstractJavaTestPluginSessionFailedException if the plug-in signals that the 'user session' has to be aborted (abort current session - continue next session)
	 * @throws AbstractJavaTestPluginUserFailedException if the plug-in signals that the user has to be terminated
	 * @throws AbstractJavaTestPluginTestFailedException if the plug-in signals that the test has to be terminated
	 * @throws Exception if an error occurs in the implementation of this method
	 */
	@Override
	public List<String> onExecute(AbstractJavaTestPluginContext pluginContext, List<String> inputValues) throws AbstractJavaTestPluginSessionFailedException, AbstractJavaTestPluginUserFailedException, AbstractJavaTestPluginTestFailedException, Exception {
		// log.message(log.LOG_INFO, "onExecute(...)");

		// --- vvv --- start of specific onExecute code --- vvv ---
		if (javaTest != null) {

		    // register the start of the sample
		    javaTest.registerSampleStart(STATISTIC_ID);

		    // measure the sample
		    final long min = 1L;
		    final long max = 20L;
		    long responseTime = Math.round(((Math.random() * (max - min)) + min));

		    // add the measured sample to the statistic
		    javaTest.addSampleLong(STATISTIC_ID, responseTime);

		    /*
		    // error case
		    javaTest.addSampleError(STATISTIC_ID,
                                    "My error subject",
                                    AbstractJavaTest.ERROR_SEVERITY_WARNING,
                                    "My error type",
                                    "My error response text or log",
                                    "");
            */
		}
		// --- ^^^ --- end of specific onExecute code --- ^^^ ---

		return new ArrayList<String>();		// no output values
	}

	/**
	 * On plug-in deconstruct. Called when the plug-in is deconstructed.
	 * @param pluginContext the plug-in context
	 * @param inputValues the list of input values
	 * @return the list of output values
	 * @throws Exception if an error occurs in the implementation of this method
	 */
	@Override
	public List<String> onDeconstruct(AbstractJavaTestPluginContext pluginContext, List<String> inputValues) throws Exception {
		// log.message(log.LOG_INFO, "onDeconstruct(...)");

		// --- vvv --- start of specific onDeconstruct code --- vvv ---
		// no code here
		// --- ^^^ --- end of specific onDeconstruct code --- ^^^ ---

		return new ArrayList<String>();		// no output values
	}

}


This example shows a JUnit Test that executes a DNS query to resolve a hostname of a domain. In addition, the received IP V4 address is verified. You can use this example to verify that a DNS hostname is currently defined and pointing to the correct IP V4 address.
If you scroll through the code below, you will notice that the Java class is not part of a Java Package and extends AbstractJUnitTest, and that there is small code at @Before and @After. This is necessary so that the JUnit test can run on the RealLoad infrastructure.
The code at @Test corresponds to a normally programmed JUnit test, with the only exception that a special logger is used (class MemoryLogAdapter, method log.message).
To compile the code, the JAR files com.dkfqs.tools.jar and junit-4.13.2.jar are required. The Java Doc of com.dkfqs.tools is published at https://download.realload.com
A simple test case was deliberately chosen so that you can become familiar with the RealLoad product. We recommend that you carry out the steps described here yourself. After you know how to get a JUnit test running, you can create any JUnit test yourself, or migrate existing JUnit tests to RealLoad - simply by replacing the @Test method of this example.
You must first create an empty file named TestDnsARecord.java in a Project’s ‘Resource Set’. ‘Resource Sets’ are something like sub-directories of a project, which contain all the files necessary to define and execute a test. New Projects and Resource Sets can be created in the Projects Menu.
Create a new Project and Resource Set: JUnit Tests / Test DNS A Record.
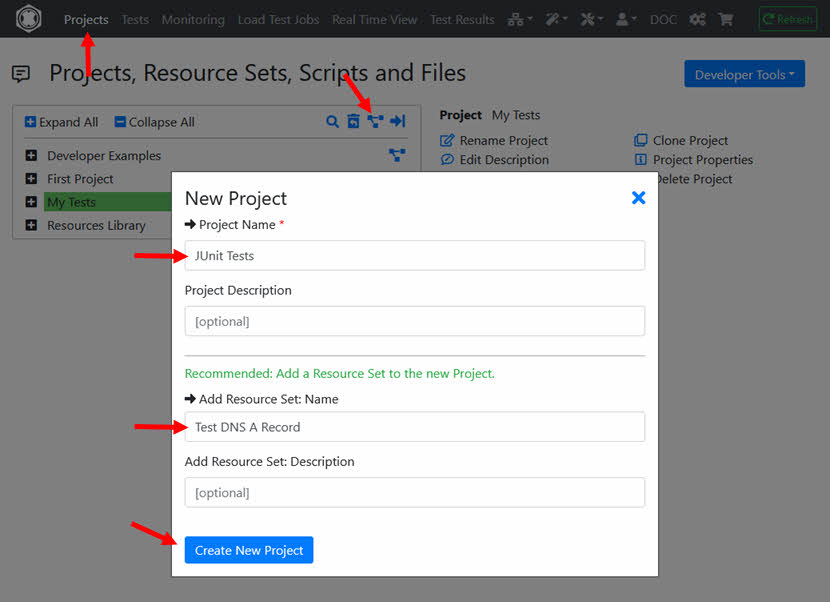
Create a new (empty) file: TestDnsARecord.java in the Resource Set.
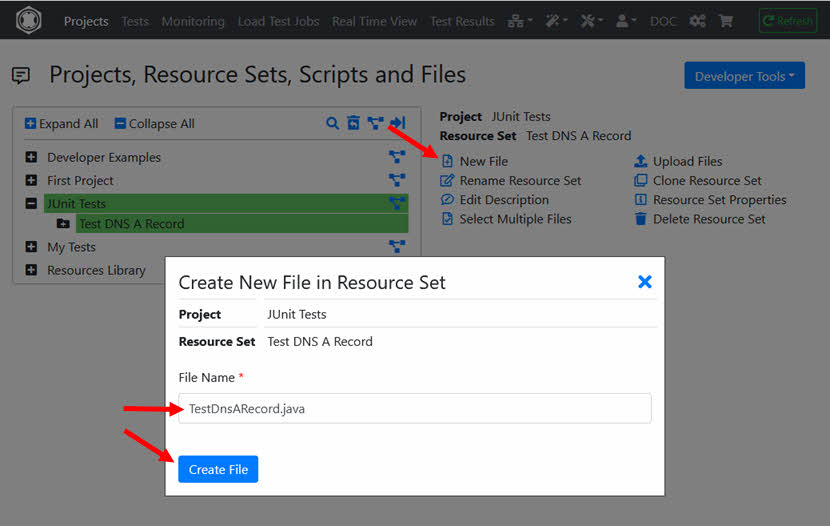
After the empty file has been created,
click on ‘Edit File’ and paste the source code shown above into the editor.
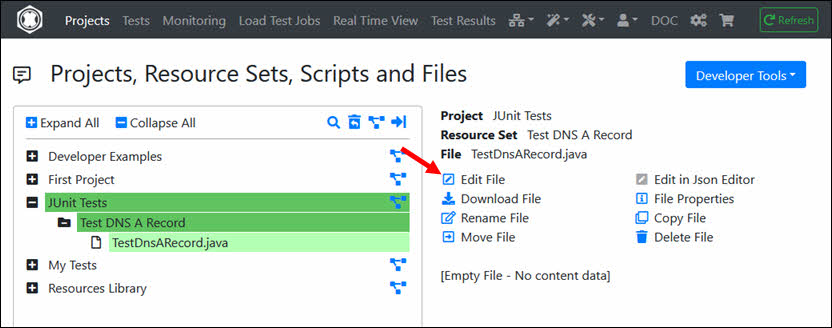
Then save the file and close the editor.
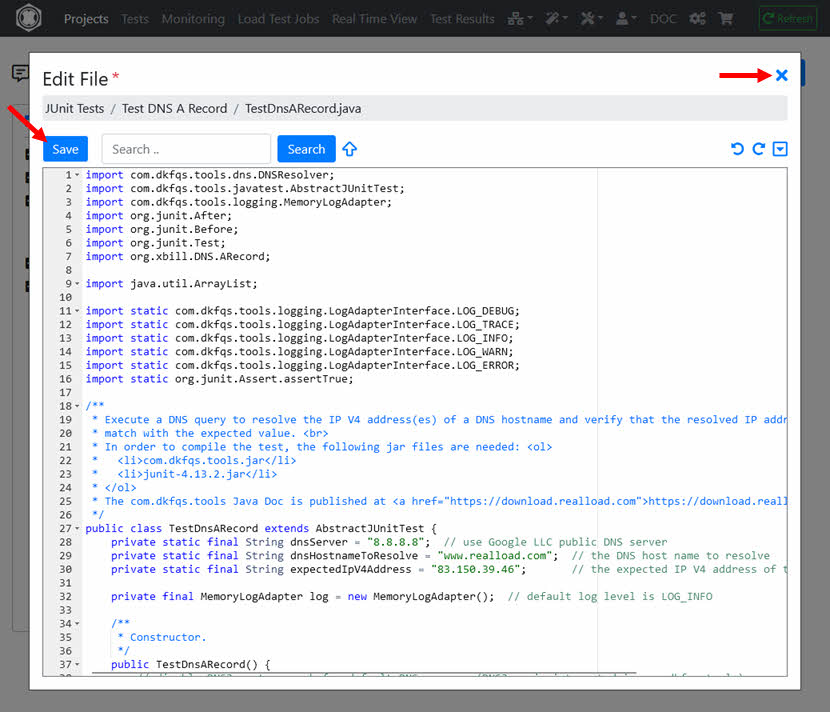
Click on the ‘Compile Java File’ icon.
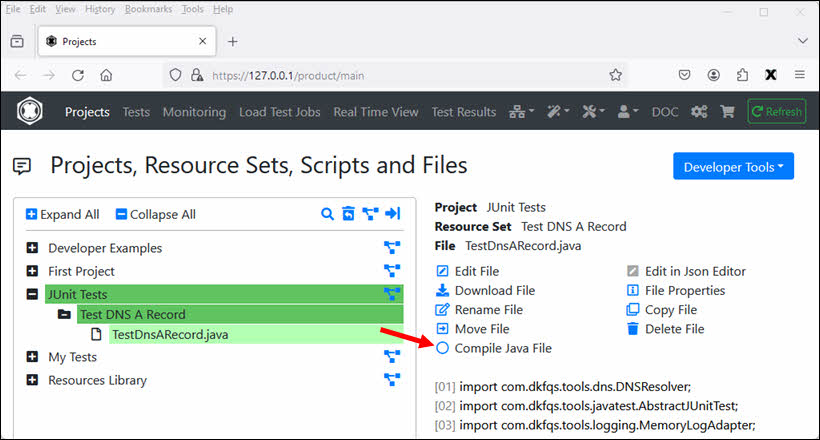
Select the JAR files com.dkfqs.tools.jar and junit-4.13.2.jar and click the ‘Compile’ button.
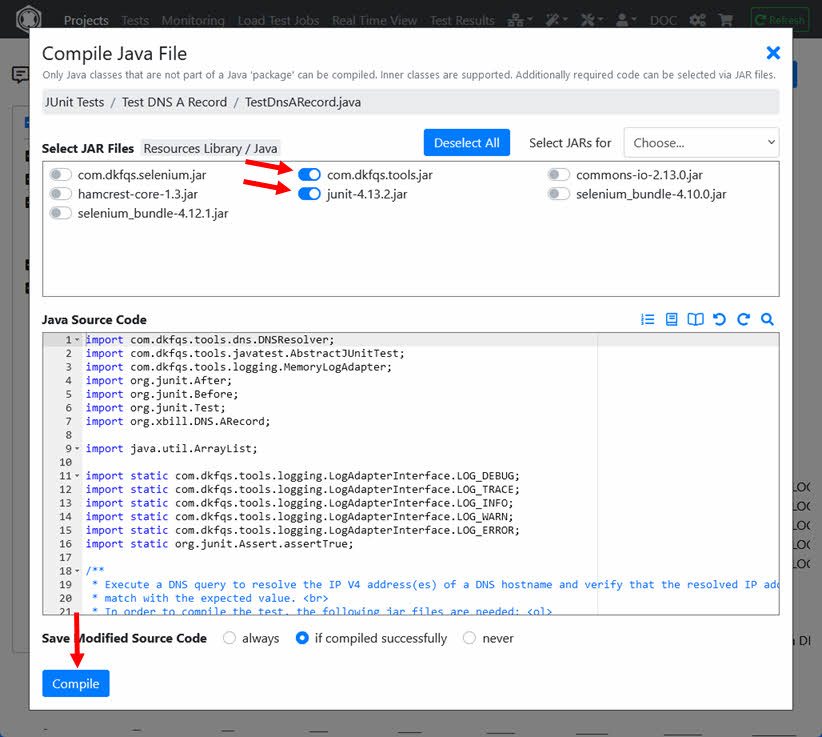
After the file has been successfully compiled click on ‘Define or Update JUnit Test’.
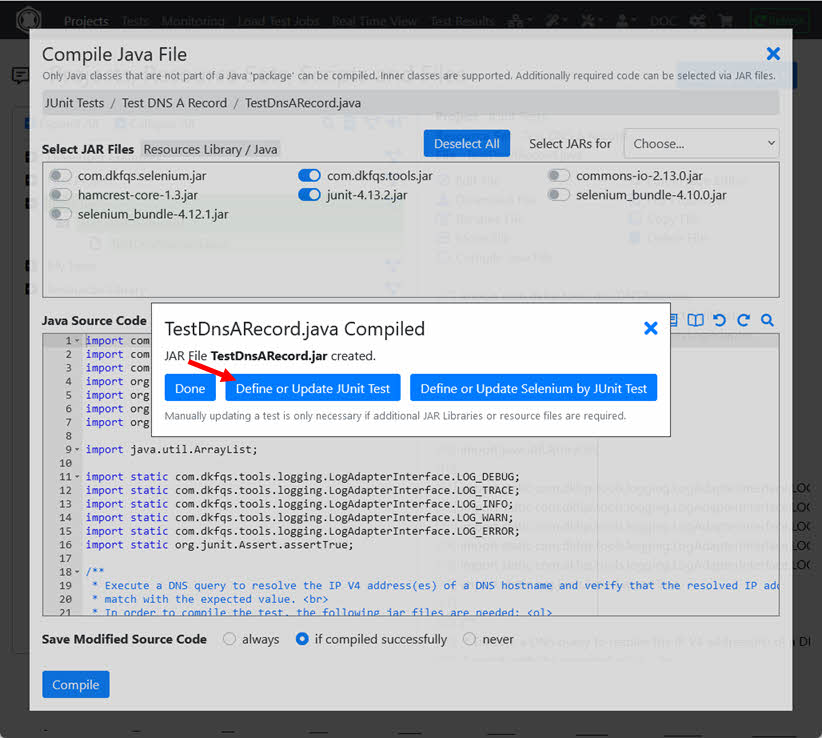
Select the @Test method (in this case resolveARecord) and click ‘Select’. Leave the switches at ‘Additional Required JAR Libraries’ as shown (default setting) and then click on ‘Define Test’.
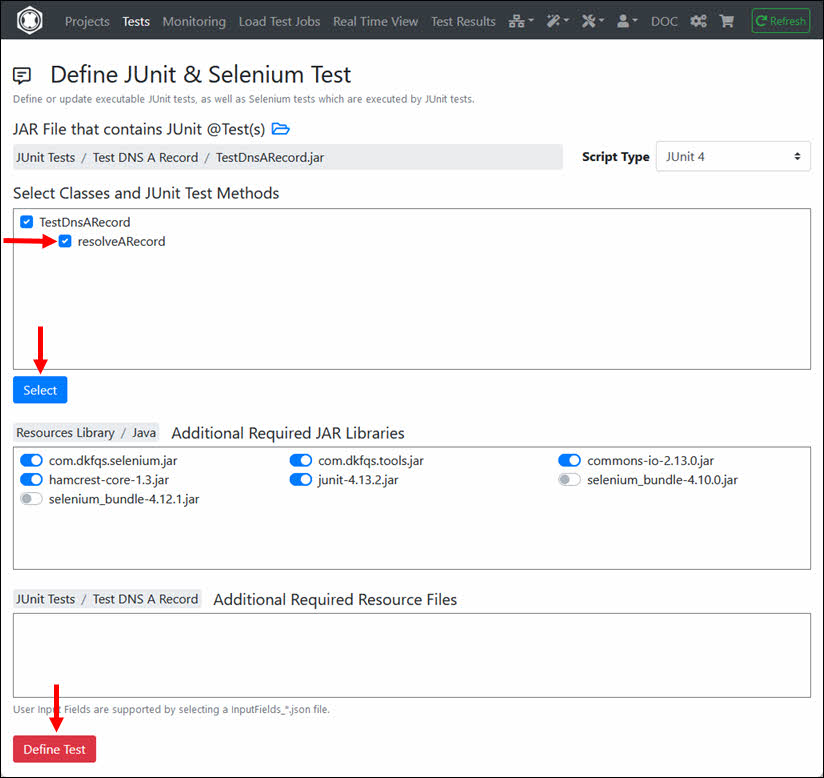
Enter the ‘Test Description’ and click on ‘Define Test’.
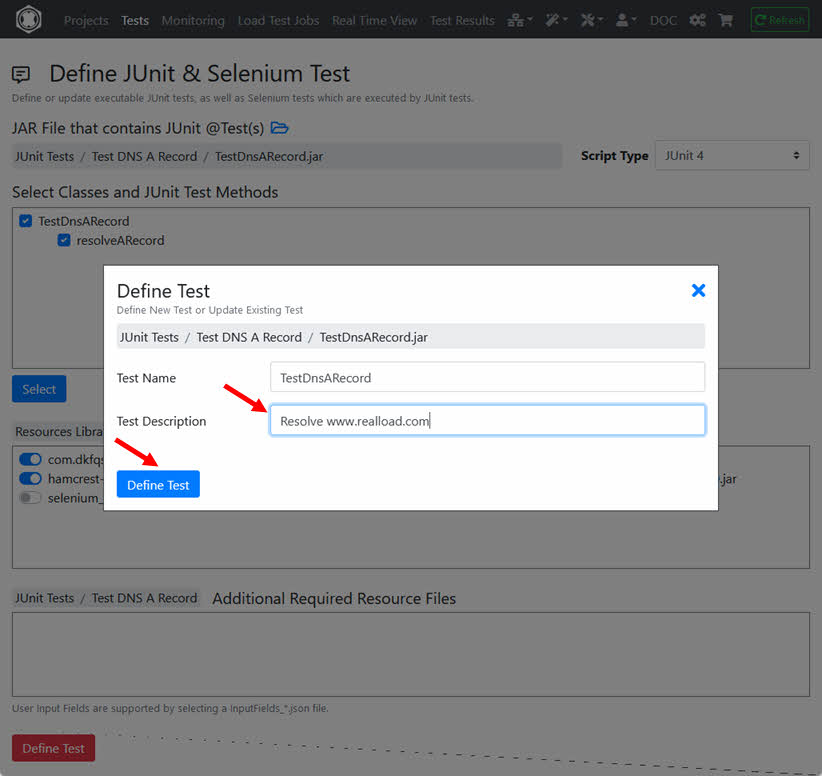
The RealLoad ‘Test’ is now defined. From here you can now create both a Load Test Job and a Monitoring Job.
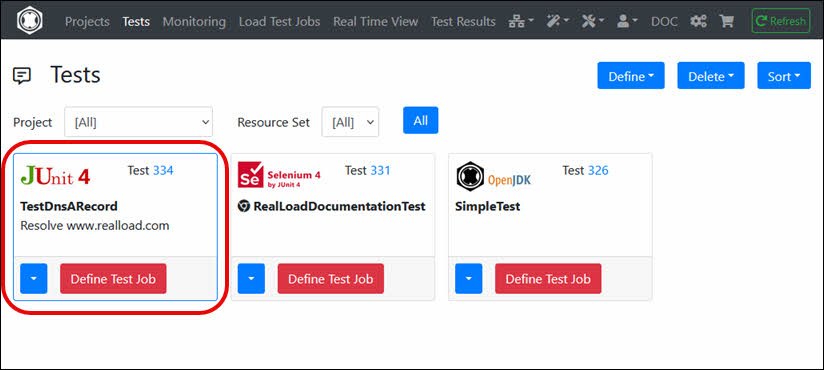
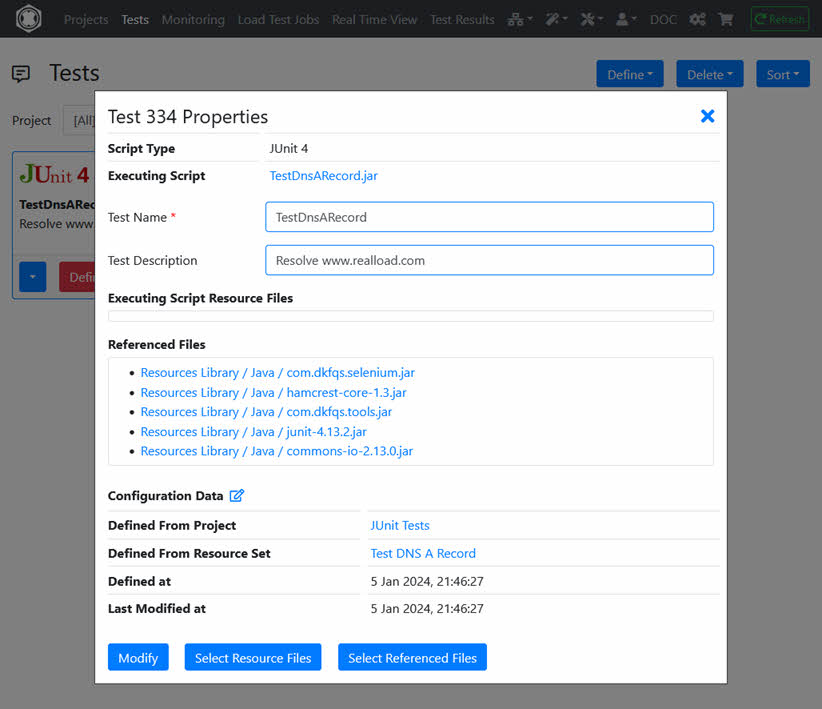
To verify that the test works correctly, first start it as a Load Test Job with only one simulated user and one loop. Click ‘Define Test Job’.
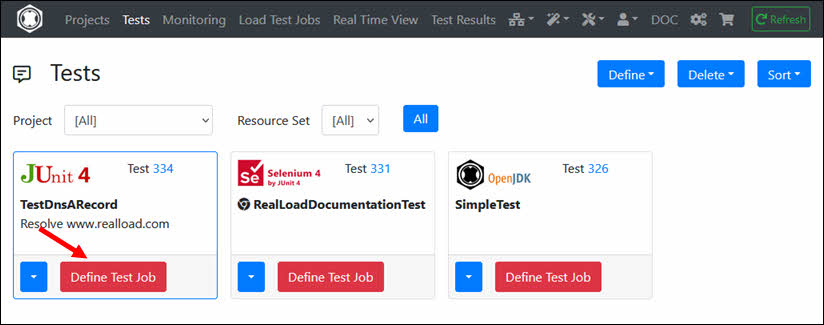
Click ‘Continue’.
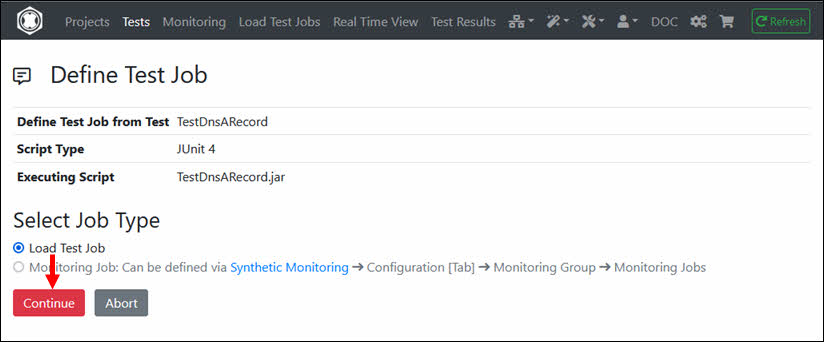
Select the Measuring Agent on which the Load Test Job will be executed and turn on the switch ‘Debug Execution’. Then click on ‘Define Load Test Job’.
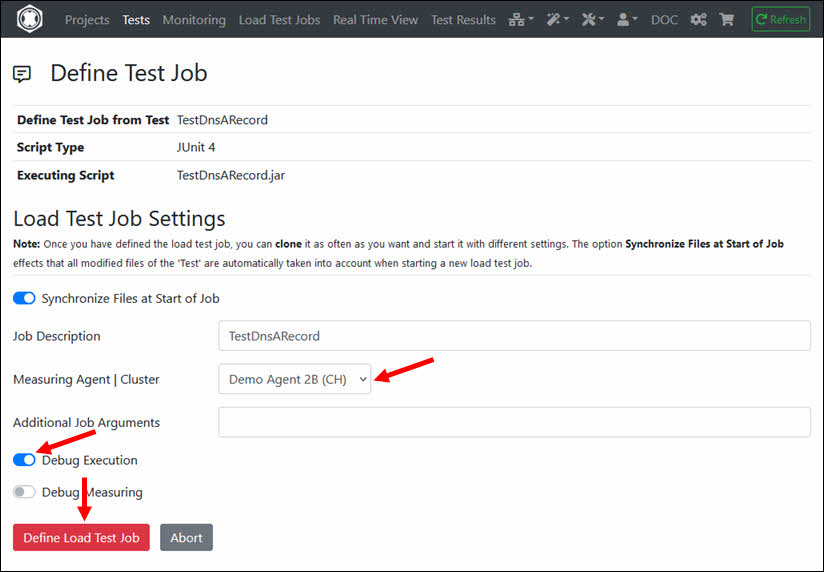
The Load Test Job is then created and in the state ‘Defined’. Click on ‘Start Test Job’.
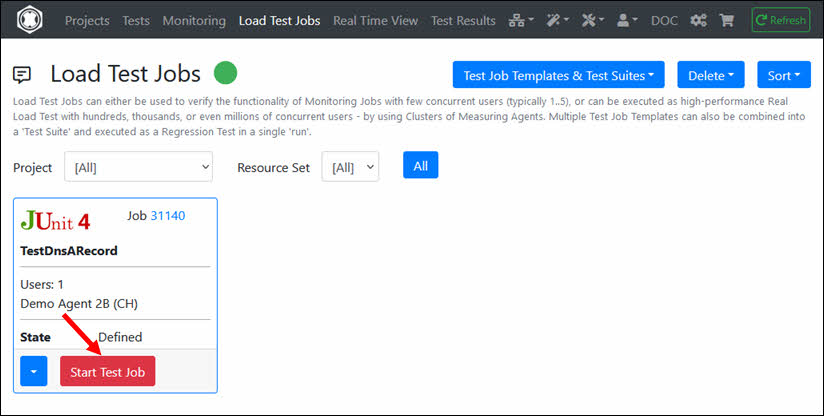
The settings of the Load Test Job are displayed, which can also be modified here (not necessary in this case). Click ‘Start Test Job’.
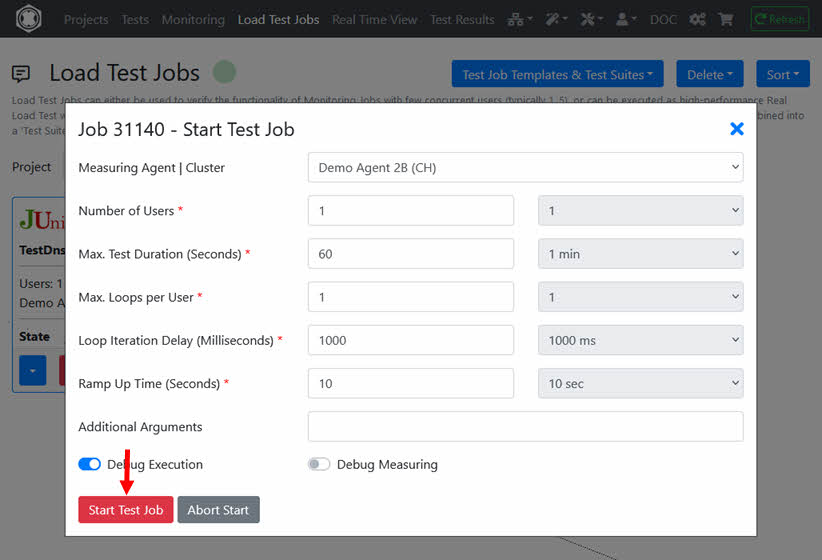
Wait a few seconds until you receive the notification that the Load Test Job has completed. Then delete the notification.
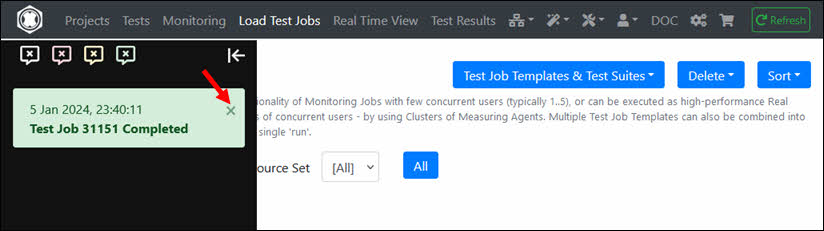
From the Load Test Job drop-down menu, select ‘Job Log Files’.
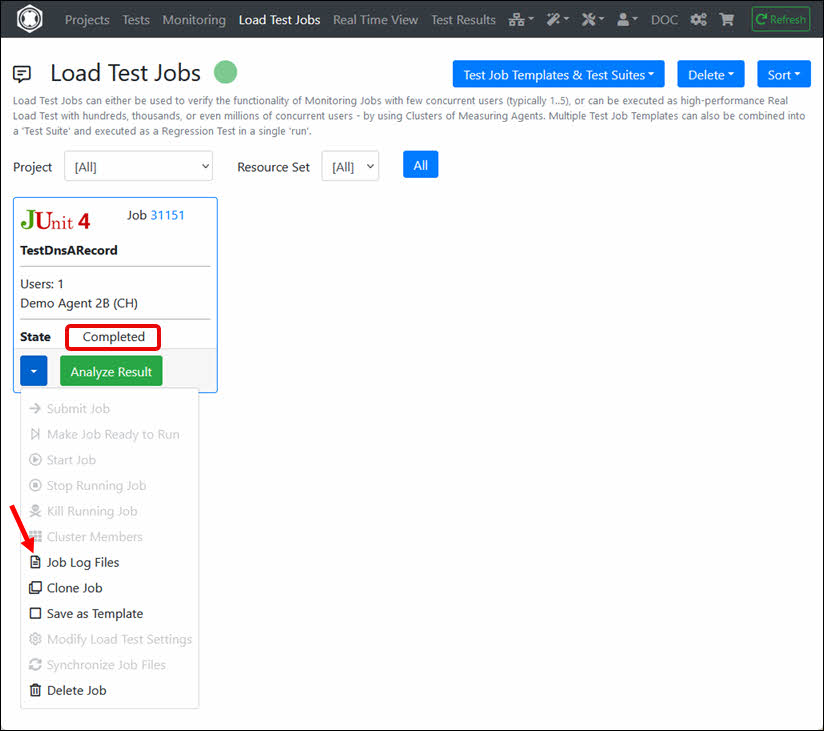
Select the Job Log File ‘users.out’.
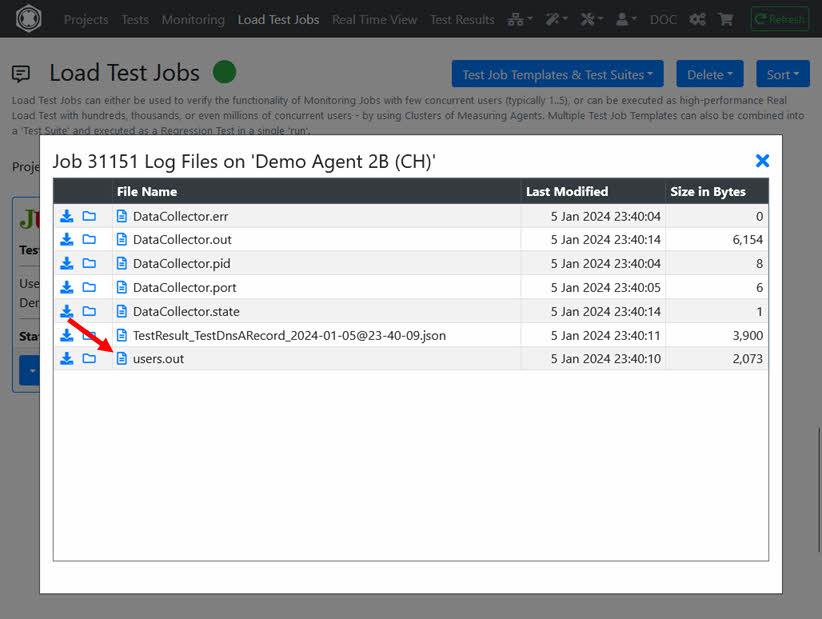
If no error or Java stack trace is displayed, the Load Test Job was executed successfully.
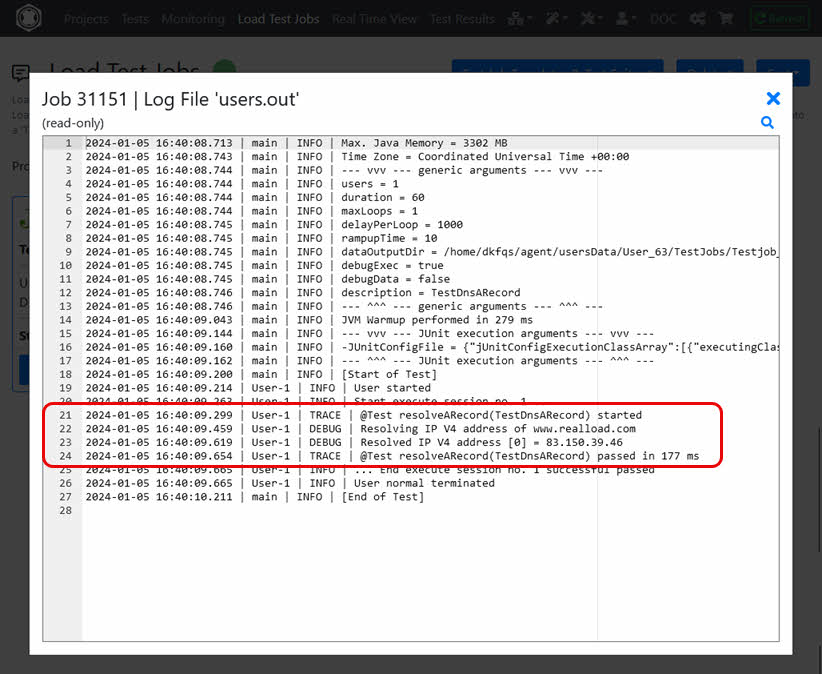
If the job log file users.out shows an error, you need to modify the Java code of the test, or you need to add additional JAR files required to run the test.
After editing the Java code, compile the Java file again and then click the ‘Define or Update JUnit Test’ button after successful compilation.
Then jump directly into the Load Test Jobs menu, ‘clone’ the Load Test Job and run it again.
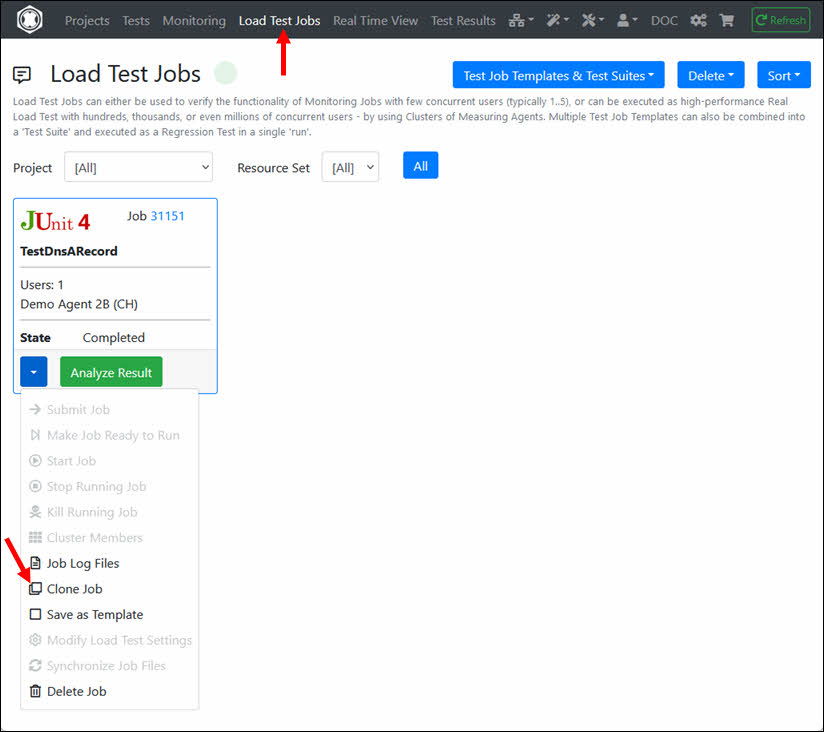
If this is your first Monitoring Job, you must first create a ‘Monitoring Group’. Navigate to Monitoring, click the ‘Configuration’ tab and then click ‘Add Monitoring Group’.
Note: There is also separate help for monitoring.

Enter the ‘Group Title’ and select at least one ‘Measuring Agent’ on which the Monitoring Job(s) will be executed. Then click ‘Add Monitoring Group’.
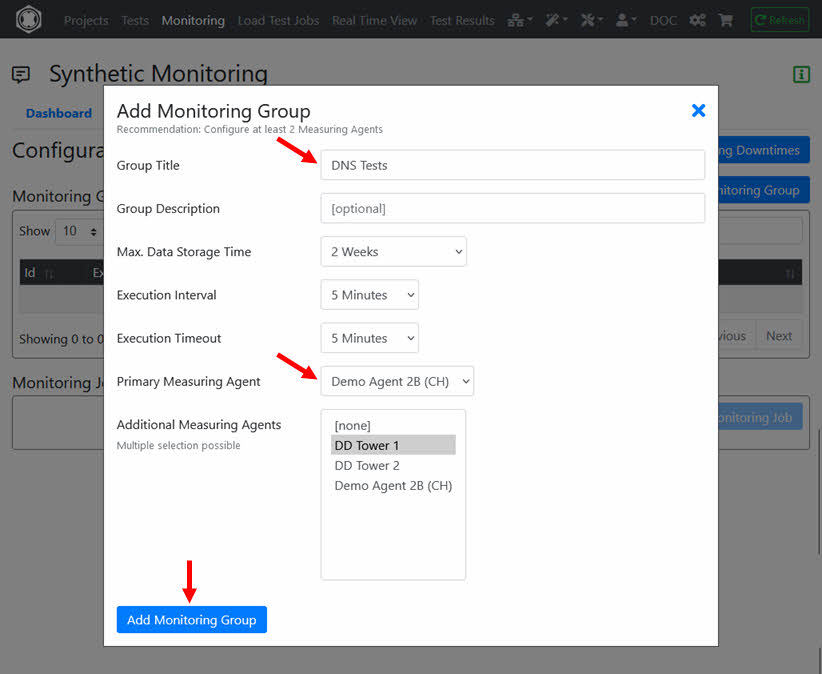
In the ‘Monitoring Group’ click ‘Monitoring Jobs’ and then click ‘Add Monitoring Job’.
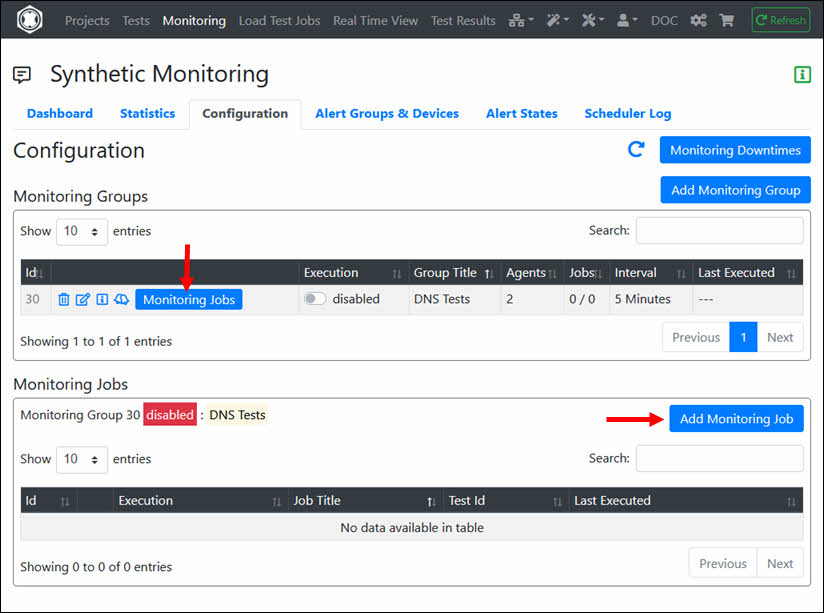
Select the ‘Test’ of the Monitoring Job.
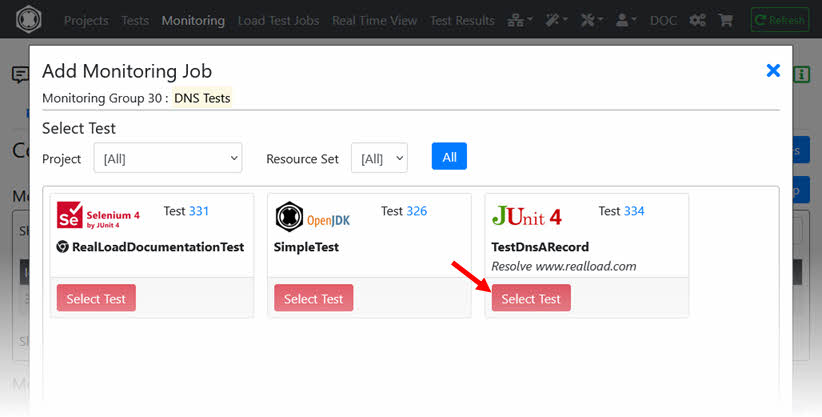
Turn on the switch ‘Debug Execution’ and click ‘Define Monitoring Job’.
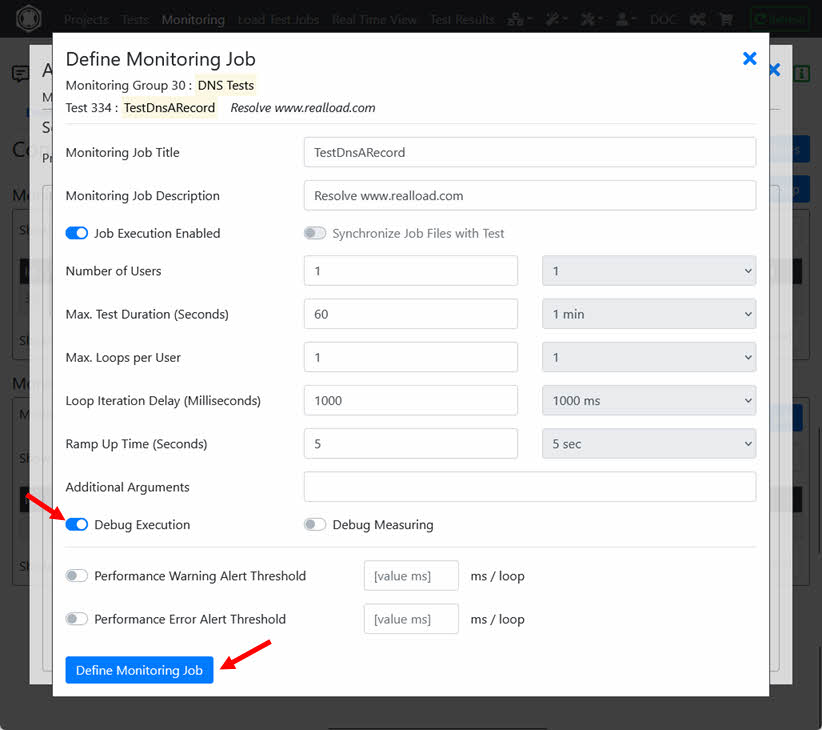
Enable the execution of the Monitoring Group and navigate to ‘Dashboard’.
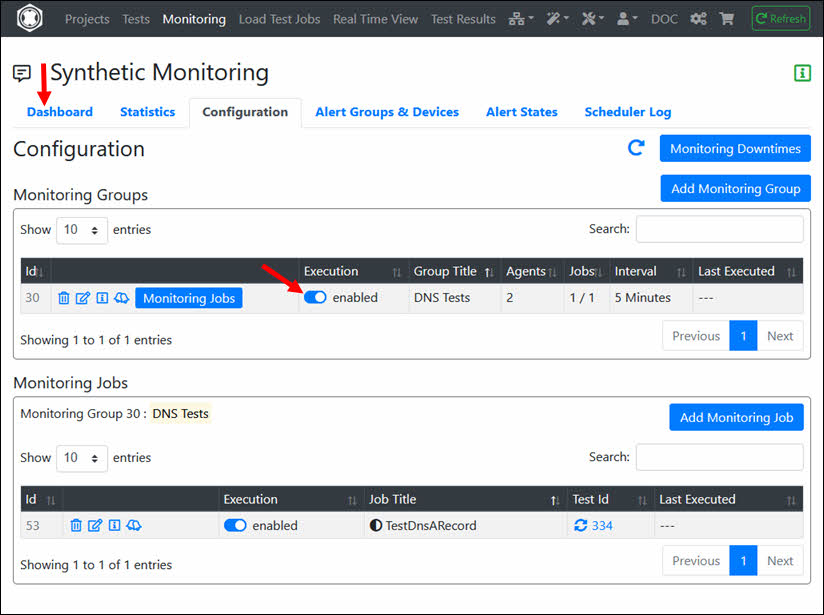
The Monitoring Job is now defined and will be executed periodically. For additional help configuring monitoring (e.g. adding ‘Alert Devices’), see Monitoring Help.
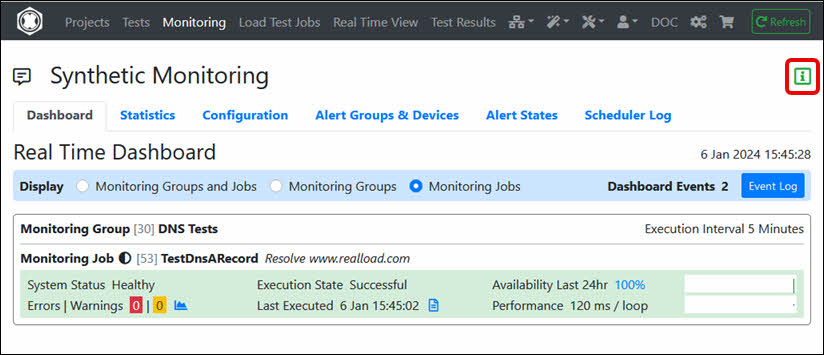
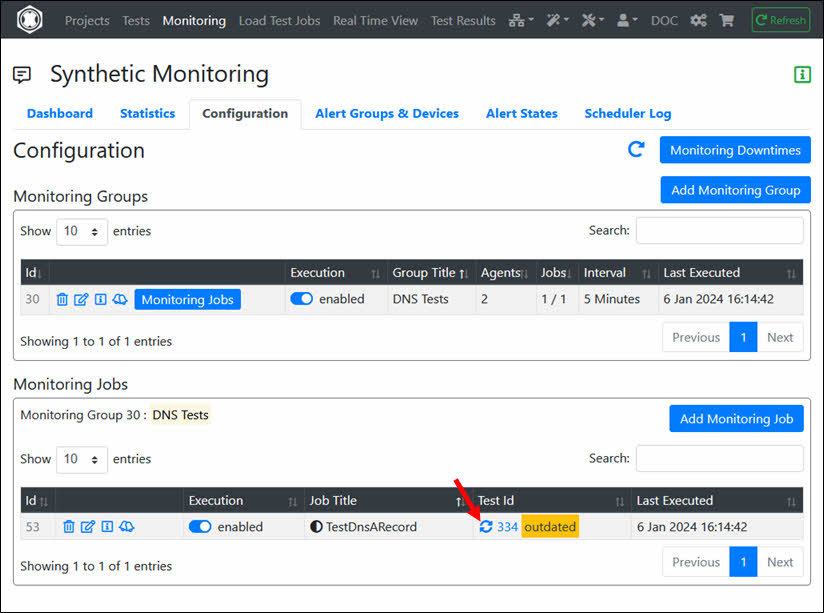
As you saw in the code before, the following 3 variables are defined as constants:
private static final String dnsServer = "8.8.8.8";  // use Google LLC public DNS server
private static final String dnsHostnameToResolve = "www.realload.com";  // the DNS host name to resolve
private static final String expectedIpV4Address = "83.150.39.46";       // the expected IP V4 address of the resolved host name
This section now describes how you can dynamically initialize these variables using User Input Fields.
The ‘User Input Fields’ values can be entered when starting a Load Test Job and when defining a Monitoring Job. This makes the test reusable, i.e. you can add the same ‘Test’ multiple times to multiple Monitoring Jobs, but use different values for the ‘User Input Fields’ for each Monitoring Job.
First you have to create a file that contains the definitions of the User Input Fields. To do this, invoke the User Input Fields Wizard.
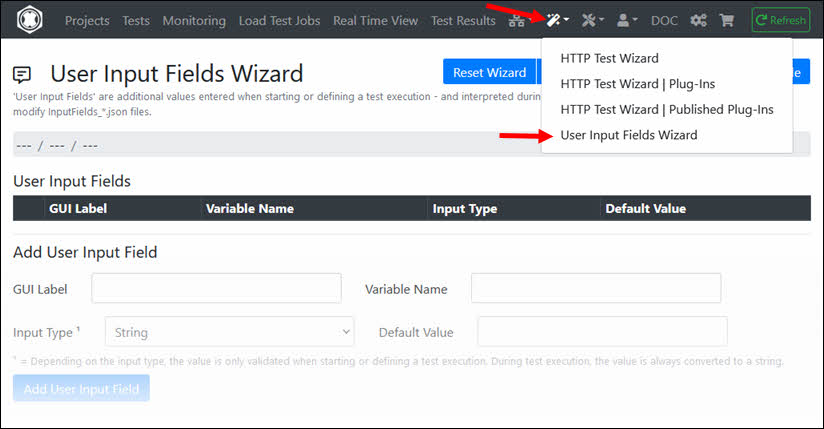
Enter (add) the 3 User Input Fields and save the file at JUnit Tests / Test DNS A Record / InputFields_TestDnsARecordGeneric.json
| GUI Label | Variable Name | Input Type | Default Value |
|---|---|---|---|
| DNS Server | dnsServer | String | 8.8.8.8 |
| Hostname to Resolve | dnsHostnameToResolve | String | www.realload.com |
| Expected IP Address | expectedIpV4Address | String | 83.150.39.46 |
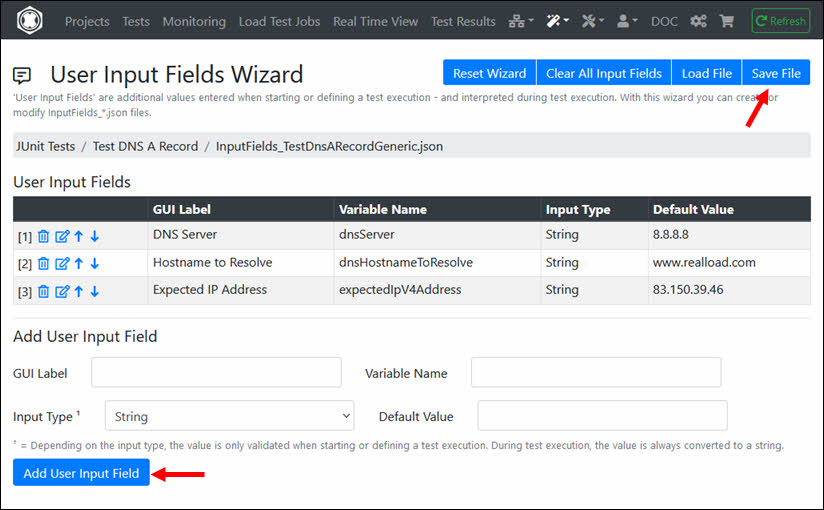
Then copy the file TestDnsARecord.java to TestDnsARecordGeneric.java and then edit TestDnsARecordGeneric.java
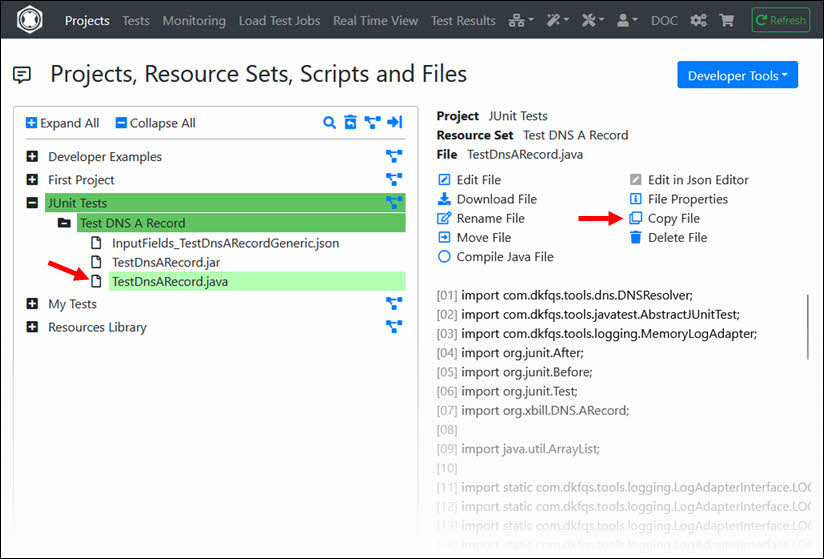
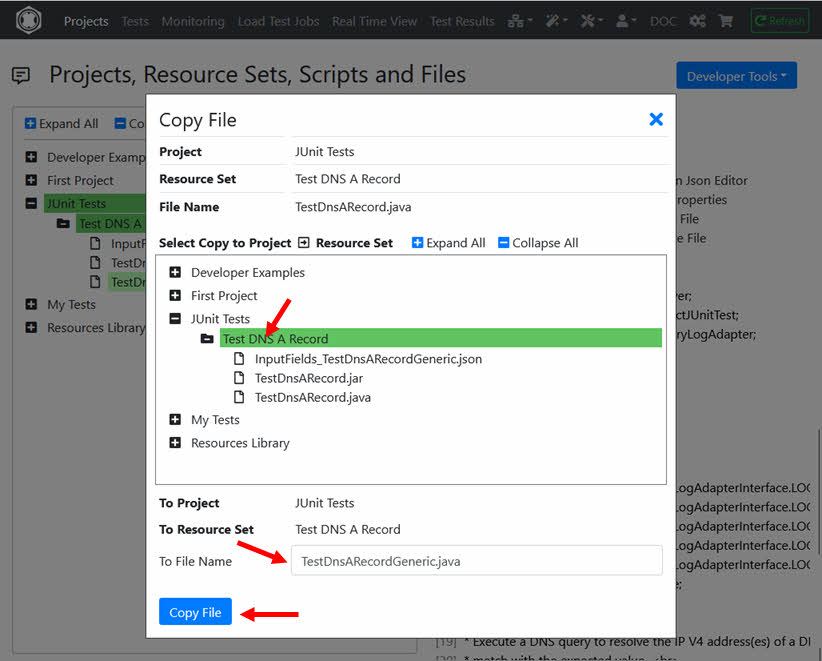
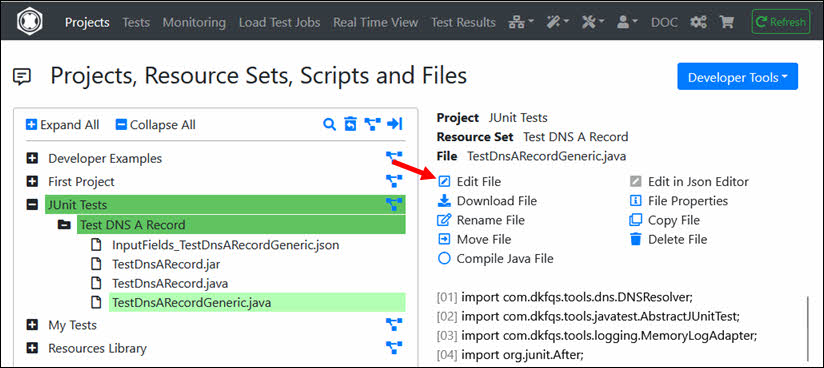
At the beginning of the Java class replace the class name and modify the 3 variables:
public class TestDnsARecordGeneric extends AbstractJUnitTest
{
    private String dnsServer;  // example: 8.8.8.8
    private String dnsHostnameToResolve; // example: www.realload.com
    private String expectedIpV4Address; // example: 83.150.39.46
Replace also the class name in the constructor:
    /**
     * Constructor.
     */
    public TestDnsARecordGeneric() {
        // disable DNSJava to search for default DNS servers (DNSJava is integrated in com.dkfqs.tools)
        System.setProperty("dnsjava.noDefaultDnsServers", "true");
    }
And modify the code @Before as follows:
    /**
    * Prepare the test.
    */
    @Before
    public void setUp() {
        if (isArgDebugExecution()) {
            log.setLogLevel(LOG_DEBUG);
        }

        // get the user input fields
        dnsServer = getUserInputField("dnsServer", null);
        if (dnsServer == null) {
            throw new RuntimeException("User input field 'dnsServer' missing");
        }
        dnsHostnameToResolve = getUserInputField("dnsHostnameToResolve", null);
        if (dnsHostnameToResolve == null) {
            throw new RuntimeException("User input field 'dnsHostnameToResolve' missing");
        }
        expectedIpV4Address = getUserInputField("expectedIpV4Address", null);
        if (expectedIpV4Address == null) {
            throw new RuntimeException("User input field 'expectedIpV4Address' missing");
        }

        openAllPurposeInterface();
    }
Then save and compile TestDnsARecordGeneric.java
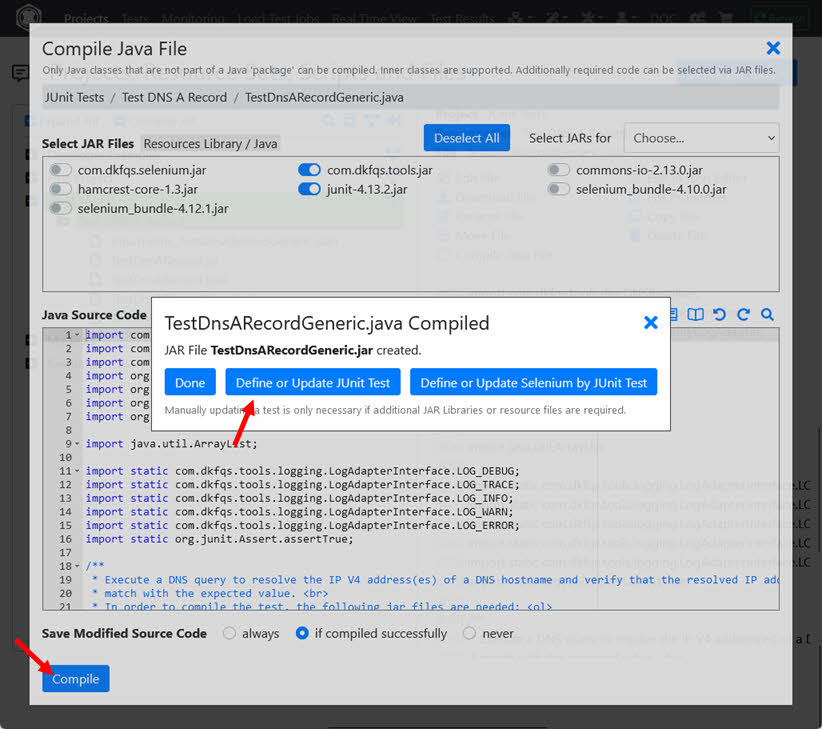
At ‘Define Test’ turn on the switch InputFields_TestDnsARecordGeneric.json at ‘Additional Required Resource Files’.
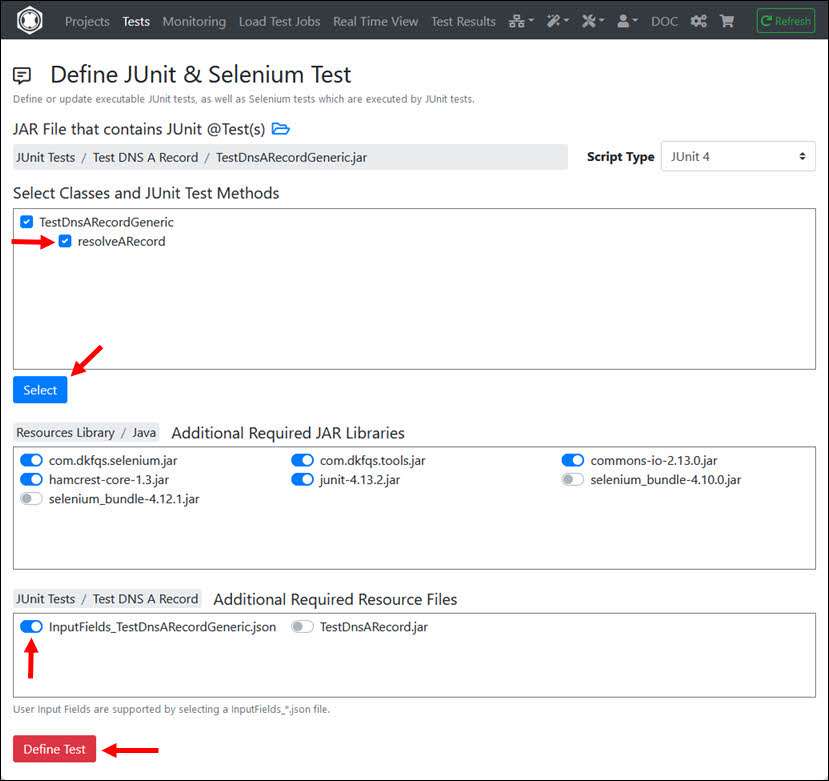
Define the Test and the corresponding Load Test Job as usual, and then start the Load Test Job. You can now enter the values for the 3 User Input Fields.
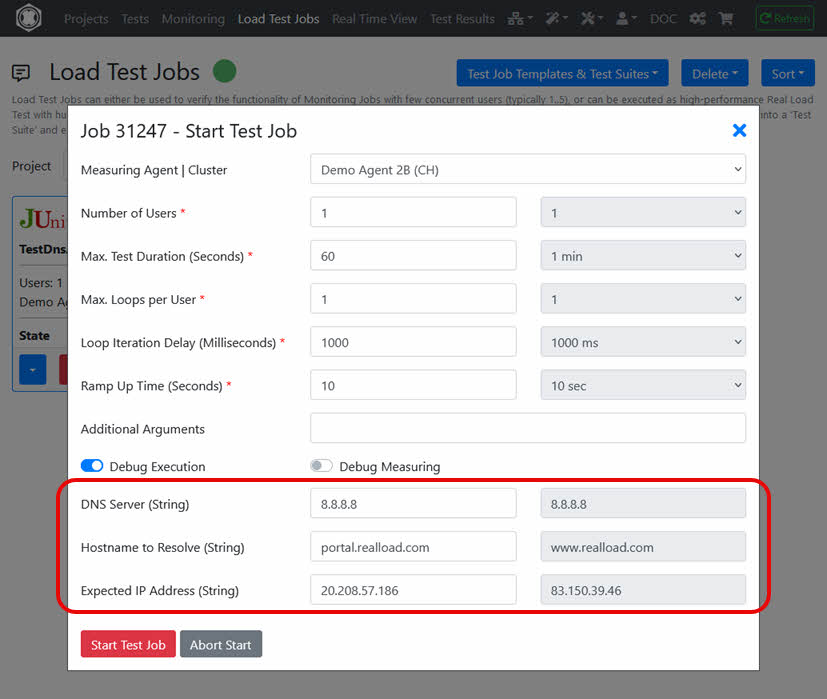
Check the log file users.out after the Load Test Job is completed.
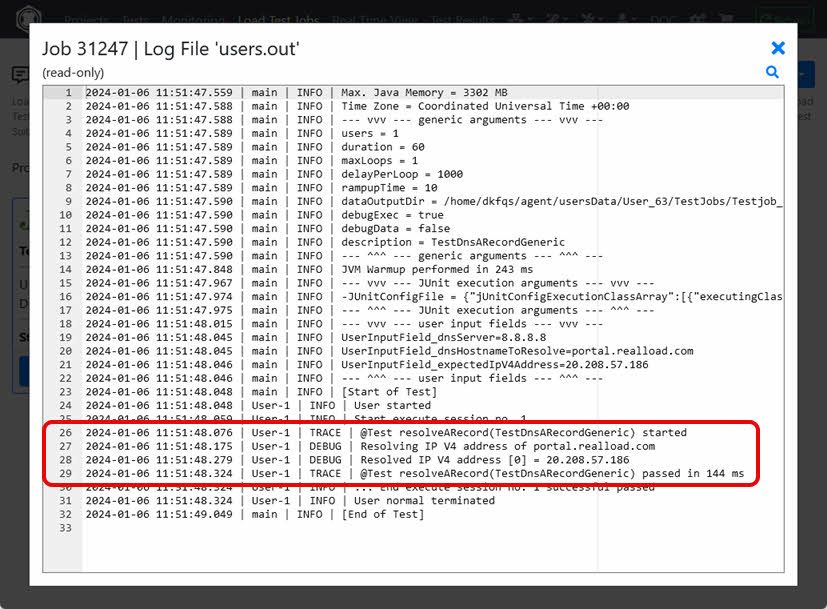
When defining a Monitoring Job, you can also enter the values for the User Input Fields.
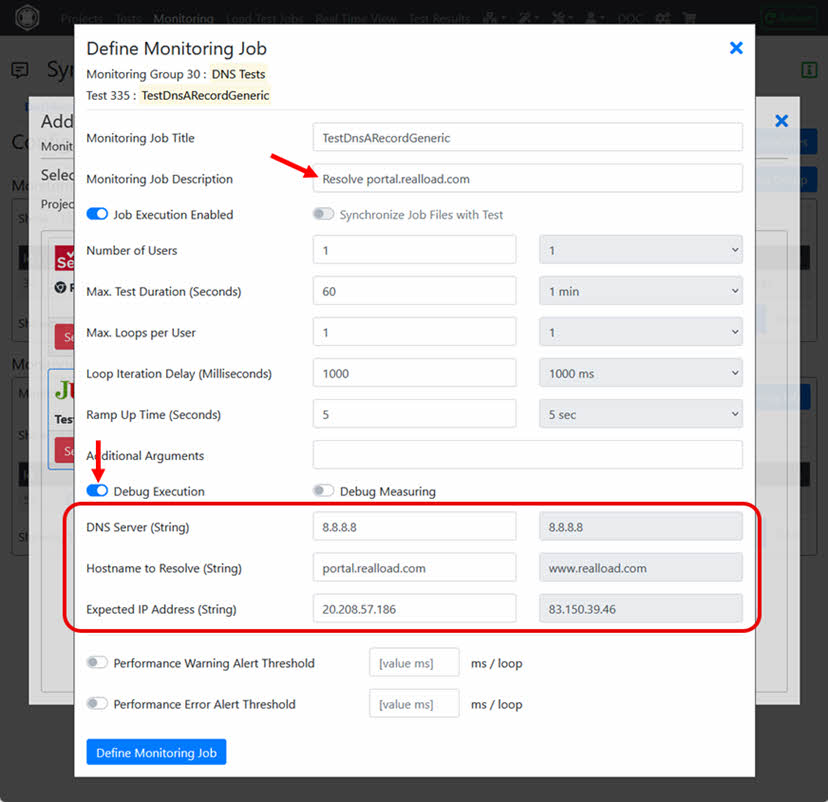
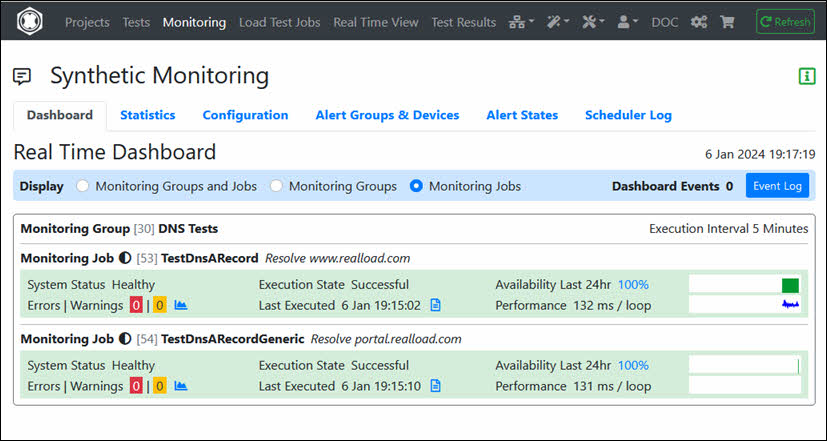
As you have seen, a JUnit Test can be run as both a Load Test Job and a Monitoring Job.
Additionally, a Test Job Template can also be defined from any ‘Load Test Job’, which can then be part of a Test Suite that is executed as Regression Test. This means that you can add multiple JUnit Tests to a Test Suite and execute them in a single run as a Regression Test.
Last but not least, note that JUnit Tests can also be executed with many, up to several thousands, virtual users - for Monitoring Jobs, for Load Tests and for Regression Tests. This is a generic feature of the RealLoad architecture which applies to all kind of RealLoad ‘Tests’.
Usually you just need a Portal Server account and to install the “Desktop Companion” on your laptop which enables you to record and upload HTTP/S sessions and to launch Measuring Agents on Amazon EC2. You don’t need a special installation license for the Desktop Companion. However, user licenses are required for using the Portal Server and to perform tests on Measuring Agents - see https://shop.realload.com/.
The RealLoad components Measuring Agent(s), Cluster Controller(s) and Remote Proxy Recorder(s) can also installed/operated on your own hosted machines.
The installation and operation of an own dedicated Portal Server requires a contract with us and a special, commercial license.
The software can be downloaded from https://download.realload.com
Desktop Companion Windows installer: https://download.realload.com/desktop_companion/latest_win64
Follow the links below to perform a manual installation.
Tests performed from ‘Measuring Agents’ which are virtualized or which run in a container environment measure often incorrect results. Because additional CPU and Network delays occur at virtualization/container level. It’s recommended that you use BARE-METAL-SERVERS to perform your tests. Alternatively you can also use Amazon EC2 Cloud instances.
You can place your ‘Measuring Agents’ at any location (anywhere at the internet or inside your local DMZ). Depending on which kind of traffic you have to test. Note that your Measuring Agents - usually running on TCP/IP port 8080 (HTTPS) - must be reachable form the ‘Portal Server’, and that you have to enable the corresponding inbound firewall rule.
In /etc/sysctl.conf add:
# TCP/IP Tuning
# =============
fs.file-max = 524288
net.ipv4.tcp_max_syn_backlog = 2048
net.ipv4.tcp_synack_retries = 3
net.ipv4.tcp_max_orphans = 65536
net.ipv4.tcp_fin_timeout = 30
net.ipv4.ip_local_port_range = 16384 60999
net.core.somaxconn = 256
net.core.rmem_max = 1048576
net.core.wmem_max = 1048576
in /etc/security/limits.conf add:
# TCP/IP Tuning
# =============
* soft     nproc          262140
* hard     nproc          262140
* soft     nofile         262140
* hard     nofile         262140
root soft     nproc          262140
root hard     nproc          262140
root soft     nofile         262140
root hard     nofile         262140
Enter: systemctl show -p TasksMax user-0
output: TasksMax=8966
if you get a value less than 262140 then add in /etc/systemd/system.conf
# Ubuntu Tuning
# =============
DefaultTasksMax=262140
Reboot the system and verify the settings. Enter: ulimit -n
output: 262140
Enter: systemctl show -p TasksMax user-0
output: TasksMax=262140
sudo apt-get update
sudo apt-get install haveged
sudo ufw allow ssh
sudo ufw allow 8080/tcp
sudo ufw logging off
sudo ufw enable
Enter: sudo ufw status verbose
Status: active
Logging: off
Default: deny (incoming), allow (outgoing), disabled (routed)
New profiles: skip

To                         Action      From
--                         ------      ----
22/tcp                     ALLOW IN    Anywhere
8080/tcp                   ALLOW IN    Anywhere
22/tcp (v6)                ALLOW IN    Anywhere (v6)
8080/tcp (v6)              ALLOW IN    Anywhere (v6)
wget https://download.java.net/openjdk/jdk8u41/ri/openjdk-8u41-b04-linux-x64-14_jan_2020.tar.gz
wget https://download.java.net/java/GA/jdk11/13/GPL/openjdk-11.0.1_linux-x64_bin.tar.gz
gunzip openjdk-8u41-b04-linux-x64-14_jan_2020.tar.gz
tar -xvf  openjdk-8u41-b04-linux-x64-14_jan_2020.tar
rm openjdk-8u41-b04-linux-x64-14_jan_2020.tar
sudo bash *******
mkdir /opt/OpenJDK
mv java-se-8u41-ri /opt/OpenJDK
cd /opt/OpenJDK
ls -al
chown root -R java-se-8u41-ri
chgrp root -R java-se-8u41-ri
exit # end sudo bash
Verify the Java 8 installation.
/opt/OpenJDK/java-se-8u41-ri/bin/java -version

openjdk version "1.8.0_41"
OpenJDK Runtime Environment (build 1.8.0_41-b04)
OpenJDK 64-Bit Server VM (build 25.40-b25, mixed mode)
gunzip openjdk-11.0.1_linux-x64_bin.tar.gz
tar -xvf openjdk-11.0.1_linux-x64_bin.tar
rm openjdk-11.0.1_linux-x64_bin.tar
sudo bash
mv jdk-11.0.1 /opt/OpenJDK
cd /opt/OpenJDK
ls -al
chown root -R jdk-11.0.1
chgrp root -R jdk-11.0.1
Execute the following commands (still as sudo bash):
update-alternatives --install "/usr/bin/java" "java" "/opt/OpenJDK/jdk-11.0.1/bin/java" 1
update-alternatives --install "/usr/bin/javac" "javac" "/opt/OpenJDK/jdk-11.0.1/bin/javac" 1
update-alternatives --install "/usr/bin/keytool" "keytool" "/opt/OpenJDK/jdk-11.0.1/bin/keytool" 1
update-alternatives --install "/usr/bin/jar" "jar" "/opt/OpenJDK/jdk-11.0.1/bin/jar" 1
update-alternatives --set "java" "/opt/OpenJDK/jdk-11.0.1/bin/java"
update-alternatives --set "javac" "/opt/OpenJDK/jdk-11.0.1/bin/javac"
update-alternatives --set "keytool" "/opt/OpenJDK/jdk-11.0.1/bin/keytool"
update-alternatives --set "jar" "/opt/OpenJDK/jdk-11.0.1/bin/jar"
exit # end sudo bash
Verify the Java 11 installation.
java -version

openjdk version "11.0.1" 2018-10-16
OpenJDK Runtime Environment 18.9 (build 11.0.1+13)
OpenJDK 64-Bit Server VM 18.9 (build 11.0.1+13, mixed mode)
sudo apt install openjdk-8-jre-headless
sudo apt install openjdk-8-jdk-headless
sudo apt install openjdk-11-jre-headless
sudo apt install openjdk-11-jdk-headless
Verify the Java installation.
java -version

openjdk version "11.0.10" 2021-01-19
OpenJDK Runtime Environment (build 11.0.10+9-Ubuntu-0ubuntu1.20.10)
OpenJDK 64-Bit Server VM (build 11.0.10+9-Ubuntu-0ubuntu1.20.10, mixed mode)
You only need to install powershell if you run load tests with powershell scripts.
# Install PowerShell
sudo snap install powershell --classic

# Start PowerShell
pwsh
exit
sudo apt install slim
sudo apt install ubuntu-desktop
Then reboot the machine.
sudo apt-get install xvfb
wget -q -O - https://dl-ssl.google.com/linux/linux_signing_key.pub | sudo apt-key add -
sudo sh -c 'echo "deb https://dl.google.com/linux/chrome/deb/ stable main" >> /etc/apt/sources.list.d/google.list'
sudo apt-get update
sudo apt-get install google-chrome-stable
sudo adduser dkfqs # follow the questions, remember or write down the password
Login with the dkfqs account (SSH) - or - Enter: sudo -u dkfqs bash | OR: Install Samba to get convenient access to /home/dkfqs as Samba dkfqs user
Create the directory /home/dkfqs/agent (as dkfqs user):
cd /home/dkfqs
mkdir agent
Create the following sub-directories at /home/dkfqs/agent (as dkfqs user):
cd /home/dkfqs/agent
mkdir bin config internalData log scripts usersData
Copy the following files to the bin directory /home/dkfqs/agent/bin
chmod 755 chromedriver
chmod 755 geckodriver
Copy the following files to the config directory /home/dkfqs/agent/config
Modify the measuringagent.properties file. Set the following properties:
# local TCP/HTTPS data collector ports
DataCollectorPortStartRange=44444
DataCollectorPortEndRange=45000
DataCollectorPortExcludeList=

LogLevel=info
MaxLifeTimeMinutes=240

MaxWebSocketConnectTimeSeconds=14400
MaxInboundWebSocketTrafficPerConnection=67108864
MaxInboundWebSocketPayloadPerFrame=1048576
MaxInboundWebSocketFramesPerIPTimeFrame=10
MaxInboundWebSocketFramesPerIPLimit=1000

RealtimeStatisticsSamplingGranularityMillis=4000
HttpsPort=8080
HttpsCertificateCN=agent2.realload.com
HttpsCertificateIP=83.150.39.43
LogLevel=info

# AuthTokenEnabled: true or false, if true = the AuthTokenValue must be configured at portal server measuring agent settings
AuthTokenEnabled=false
# If AuthTokenEnabled is true, but AuthTokenValue is undefined or an empty string, then the (permanent) AuthTokenValue is automatically generated and printed at the log output
# AuthTokenValue=

MeasuringAgentLogFile=/home/dkfqs/agent/log/MeasuringAgent.log
MeasuringAgentInternalDataDirectory=/home/dkfqs/agent/internalData
MeasuringAgentUsersDataRootDirectory=/home/dkfqs/agent/usersData

ApiV1MaxRequestSizeMB=256
ApiV1WorkerThreadBusyTimeoutSeconds=330
ApiV1WorkerThreadExecutionTimeoutSeconds=300

MaxWebSocketConnectTimeSeconds=14400
MaxInboundWebSocketTrafficPerConnection=160000000
MaxInboundWebSocketPayloadPerFrame=80000000
MaxInboundWebSocketFramesPerIPTimeFrame=10
MaxInboundWebSocketFramesPerIPLimit=1000

DataCollectorProcessJavaPath=java
DataCollectorProcessJavaXmx=512m
DataCollectorPropertiesPath=/home/dkfqs/agent/config/datacollector.properties

# Settings for Supported Scripts / Programming Languages
PowerShellCore6Path=/snap/bin/pwsh
OpenJDK8JavaPath=/opt/OpenJDK/java-se-8u41-ri/bin/java
OpenJDK8JavaJobDefaultXmx=512m
OpenJDK11JavaPath=/opt/OpenJDK/jdk-11.0.1/bin/java
OpenJDK11JavaJobDefaultXmx=512m

# Limits
# LimitMaxUsersPerJob=500
# LimitMaxJobDurationSeconds=300

# Settings for Synthetic Monitoring
SyntheticMonitoringDataCollectorProcessJavaXmx=128m
SyntheticMonitoringOpenJDK8JavaJobXmx=256m
SyntheticMonitoringOpenJDK11JavaJobXmx=256m
SyntheticMonitoringLimitMaxUsersPerJob=5
SyntheticMonitoringLimitMaxJobDurationSeconds=300
SyntheticMonitoringLimitMaxLoopsPerUser=5

# Settings for Tests Jobs which require a (virtual) display. If VirtualDisplayPerRemoteUserIdEnabled = false then the value of DebugDisplay is used
DebugDisplay=:0.0
VirtualDisplayPerRemoteUserIdEnabled=true
VirtualDisplayType=Xvfb
XvfbPath=Xvfb
SeleniumTestJobsEnabled=true
SeleniumLimitMaxUsersPerJob=20
SeleniumWebBrowserTypesSupported=Chrome,Firefox
SeleniumChromeDriverPath=/home/dkfqs/agent/bin/chromedriver
SeleniumGeckoDriverPath=/home/dkfqs/agent/bin/geckodriver
SeleniumEdgeDriverPath=
cd /home/dkfqs/agent/bin
export CLASSPATH=bcpkix-jdk15on-160.jar:bcprov-jdk15on-160.jar:bctls-jdk15on-160.jar:DKFQSMeasuringAgent.jar
java -Xmx512m -DdkfqsMeasuringAgentProperties=../config/measuringagent.properties -Dnashorn.args="--no-deprecation-warning" com.dkfqs.measuringagent.internal.StartDKFQSMeasuringAgent

Data Collector service port range from 44444 to 45000
LimitMaxUsersPerJob = unlimited
LimitMaxJobDurationSeconds = unlimited
X509 TLS server certificate generated for CN = 192.168.0.51
Internal RSA 2048 bit keypair generated in 373 ms
2021-03-11 18:20:27.947 | QAHTTPd | WARN | QAHTTPd V1.3-U started
2021-03-11 18:20:27.990 | QAHTTPd | INFO | HTTPS server starting at port 8080
2021-03-11 18:20:28.089 | QAHTTPd | INFO | HTTPS server ready at port 8080
sudo bash # become root
cd /etc/init.d
vi MeasuringAgent
Edit - create /etc/init.d/MeasuringAgent
#!/bin/sh
# /etc/init.d/MeasuringAgent
# install with: update-rc.d MeasuringAgent defaults

### BEGIN INIT INFO
# Provides:          MeasuringAgent
# Required-Start:    $local_fs $network $time $syslog
# Required-Stop:     $local_fs $network
# Default-Start:     2 3 4 5
# Default-Stop:      0 1 6
# Short-Description: Start MeasuringAgent daemon at boot time
# Description:       MeasuringAgent daemon
### END INIT INFO

case "$1" in
  start)
    if [ -f /home/dkfqs/agent/log/MeasuringAgent.log ]; then
       mv /home/dkfqs/agent/log/MeasuringAgent.log /home/dkfqs/agent/log/MeasuringAgent.log_$(date +"%Y_%m_%d_%H_%M")
    fi
    sudo -H -u dkfqs bash -c 'CLASSPATH=/home/dkfqs/agent/bin/bcpkix-jdk15on-160.jar:/home/dkfqs/agent/bin/bcprov-jdk15on-160.jar:/home/dkfqs/agent/bin/bctls-jdk15on-160.jar:/home/dkfqs/agent/bin/DKFQSMeasuringAgent.jar;export CLASSPATH;nohup java -Xmx512m -DdkfqsMeasuringAgentProperties=/home/dkfqs/agent/config/measuringagent.properties -Dnashorn.args="--no-deprecation-warning" com.dkfqs.measuringagent.internal.StartDKFQSMeasuringAgent -autoAdjustMemory -osReservedMemory 1GB 1>/home/dkfqs/agent/log/MeasuringAgent.log 2>&1 &'
    ;;
  stop)
       PID=`ps -o pid,args -e | grep "StartDKFQSMeasuringAgent" | egrep -v grep | awk '{print $1}'`
       if [ ! -z "$PID" ] ; then
          echo "MeasuringAgent stopped with pid(s) : $PID"
          kill -9 ${PID} 1> /dev/null 2>&1
       fi
    ;;
  status)
       PID=`ps -o pid,args -e | grep "StartDKFQSMeasuringAgent" | egrep -v grep | awk '{print $1}'`
       if [ ! -z "$PID" ] ; then
          echo "MeasuringAgent running with pid(s) : $PID"
       else
          echo "No MeasuringAgent running"
       fi
    ;;
  *)
    echo "Usage: /etc/init.d/MeasuringAgent {start|stop|status}"
    exit 1
    ;;
esac

exit 0
The Java memory of the Measuring Agent should be set in the startup script as shown in the table below:
| OS Physical Memory | Java -Xmx setting |
|---|---|
| <2 GiB | 256m |
| 2..3 GiB | 512m |
| 4..7 GiB | 512m |
| 8..15 GiB | 1536m |
| 16..31 GiB | 3072m |
| 32..63 GiB | 4096m |
| 64..96 GiB | 6144m |
| >96 GiB | 8192m |
| Odd number of GiB should be rounded up (e.g. 7.7 = 8 = 1536m). |
Change owner and file protection of /etc/init.d/MeasuringAgent (root at /etc/init.d):
chown root MeasuringAgent
chgrp root MeasuringAgent
chmod 755 MeasuringAgent
Register /etc/init.d/MeasuringAgent to be started at system boot (root at /etc/init.d):
update-rc.d MeasuringAgent defaults
Reboot the system. Login as dkfqs and check /home/dkfqs/agent/log/MeasuringAgent.log


In terms of network technology, the cluster controller should be as close as possible to the cluster members.
The simultaneous operation of a cluster controller together with one or more measuring agents on the same machine is possible, although not recommended. This means that the cluster controller should be operated on its own machine - especially if a cluster contains more than 100 members.
The time difference of the operating system time between the cluster controller and the cluster members must not be greater than one second (1000 ms). It is recommended to use the same time server for the cluster controller and the cluster members.
The Portal Server supports the use of multiple cluster controllers. Each cluster controller can manage multiple clusters. And each measuring agent can be a member of multiple clusters.
In /etc/sysctl.conf add:
# TCP/IP Tuning
# =============
fs.file-max = 524288
net.ipv4.tcp_max_syn_backlog = 2048
net.ipv4.tcp_synack_retries = 3
net.ipv4.tcp_max_orphans = 65536
net.ipv4.tcp_fin_timeout = 30
net.ipv4.ip_local_port_range = 16384 60999
net.core.somaxconn = 256
net.core.rmem_max = 1048576
net.core.wmem_max = 1048576
in /etc/security/limits.conf add:
# TCP/IP Tuning
# =============
* soft     nproc          262140
* hard     nproc          262140
* soft     nofile         262140
* hard     nofile         262140
root soft     nproc          262140
root hard     nproc          262140
root soft     nofile         262140
root hard     nofile         262140
Enter: systemctl show -p TasksMax user-0
output: TasksMax=8966
if you get a value less than 262140 then add in /etc/systemd/system.conf
# Ubuntu Tuning
# =============
DefaultTasksMax=262140
Reboot the system and verify the settings. Enter: ulimit -n
output: 262140
Enter: systemctl show -p TasksMax user-0
output: TasksMax=262140
sudo apt-get update
sudo apt-get install haveged
wget https://download.java.net/java/GA/jdk11/13/GPL/openjdk-11.0.1_linux-x64_bin.tar.gz
gunzip openjdk-11.0.1_linux-x64_bin.tar.gz
tar -xvf openjdk-11.0.1_linux-x64_bin.tar
rm openjdk-11.0.1_linux-x64_bin.tar
sudo bash
mv jdk-11.0.1 /opt/OpenJDK
cd /opt/OpenJDK
ls -al
chown root -R jdk-11.0.1
chgrp root -R jdk-11.0.1
Execute the following commands (still as sudo bash):
update-alternatives --install "/usr/bin/java" "java" "/opt/OpenJDK/jdk-11.0.1/bin/java" 1
update-alternatives --install "/usr/bin/javac" "javac" "/opt/OpenJDK/jdk-11.0.1/bin/javac" 1
update-alternatives --install "/usr/bin/keytool" "keytool" "/opt/OpenJDK/jdk-11.0.1/bin/keytool" 1
update-alternatives --install "/usr/bin/jar" "jar" "/opt/OpenJDK/jdk-11.0.1/bin/jar" 1
update-alternatives --set "java" "/opt/OpenJDK/jdk-11.0.1/bin/java"
update-alternatives --set "javac" "/opt/OpenJDK/jdk-11.0.1/bin/javac"
update-alternatives --set "keytool" "/opt/OpenJDK/jdk-11.0.1/bin/keytool"
update-alternatives --set "jar" "/opt/OpenJDK/jdk-11.0.1/bin/jar"
exit # end sudo bash
Verify the Java 11 installation.
java -version

openjdk version "11.0.1" 2018-10-16
OpenJDK Runtime Environment 18.9 (build 11.0.1+13)
OpenJDK 64-Bit Server VM 18.9 (build 11.0.1+13, mixed mode)
sudo adduser dkfqs # follow the questions, remember or write down the password
Login with the dkfqs account (SSH) - or - Enter: sudo -u dkfqs bash | OR: Install Samba to get convenient access to /home/dkfqs as Samba dkfqs user
Create the directory /home/dkfqs/controller (as dkfqs user):
cd /home/dkfqs
mkdir controller
Create the following sub-directories at /home/dkfqs/controller (as dkfqs user):
cd /home/dkfqs/controller
mkdir bin config internalData log scripts usersData
Copy the following files to the bin directory /home/dkfqs/controller/bin
Copy the following files to the config directory /home/dkfqs/controller/config
Modify the clustercontroller.properties file. Set the following properties:
HttpsPort=8083
HttpsCertificateCN=192.168.0.50
HttpsCertificateIP=192.168.0.50
LogLevel=info
# AuthTokenEnabled: true or false, if true = the AuthTokenValue must be configured at portal server measuring agent cluster settings
AuthTokenEnabled=true
# If AuthTokenEnabled is true, but AuthTokenValue is undefined or an empty string, then the (permanent) AuthTokenValue is automatically generated and printed at the log output
AuthTokenValue=aberaber
ClusterControllerLogFile=/home/dkfqs/controller/log/ClusterController.log
ClusterControllerInternalDataDirectory=/home/dkfqs/controller/internalData
ClusterControllerUsersDataRootDirectory=/home/dkfqs/controller/usersData
ApiMaxRequestSizeMB=256
ApiWorkerThreadBusyTimeoutSeconds=330
ApiWorkerThreadExecutionTimeoutSeconds=300
MaxWebSocketConnectTimeSeconds=14400
MaxInboundWebSocketTrafficPerConnection=83886080
MaxInboundWebSocketPayloadPerFrame=20971520
MaxInboundWebSocketFramesPerIPTimeFrame=10
MaxInboundWebSocketFramesPerIPLimit=1000
cd /home/dkfqs/controller/bin
export CLASSPATH=bcpkix-jdk15on-160.jar:bcprov-jdk15on-160.jar:bctls-jdk15on-160.jar:DKFQSMeasuringAgent.jar
java -Xmx512m -DdkfqsClusterControllerProperties=../config/clustercontroller.properties -Dnashorn.args="--no-deprecation-warning" com.dkfqs.measuringagent.clustercontroller.StartDKFQSClusterController
Cluster Controller V4.0.4
Max. Memory = 512 MB
AuthTokenEnabled = true
AuthTokenValue = ********
X509 TLS server certificate generated for CN = 192.168.0.50
Internal RSA 2048 bit keypair generated in 305 ms
2022-01-29 20:45:20.118 | QAHTTPd | WARN | QAHTTPd V1.3-Y started
2022-01-29 20:45:20.219 | QAHTTPd | INFO | HTTPS server starting at port 8083
2022-01-29 20:45:20.278 | QAHTTPd | INFO | HTTPS server ready at port 8083
sudo bash # become root
cd /etc/init.d
vi ClusterController
Edit - create /etc/init.d/ClusterController
#!/bin/sh
# /etc/init.d/ClusterController
# install with: update-rc.d ClusterController defaults
### BEGIN INIT INFO
# Provides: ClusterController
# Required-Start: $local_fs $network $time $syslog
# Required-Stop: $local_fs $network
# Default-Start: 2 3 4 5
# Default-Stop: 0 1 6
# Short-Description: Start ClusterController daemon at boot time
# Description: ClusterController daemon
### END INIT INFO
case "$1" in
start)
if [ -f /home/dkfqs/controller/log/ClusterController.log ]; then
mv /home/dkfqs/controller/log/ClusterController.log /home/dkfqs/controller/log/ClusterController.log_$(date +"%Y_%m_%d_%H_%M")
fi
sudo -H -u dkfqs bash -c 'CLASSPATH=/home/dkfqs/controller/bin/bcpkix-jdk15on-160.jar:/home/dkfqs/controller/bin/bcprov-jdk15on-160.jar:/home/dkfqs/controller/bin/bctls-jdk15on-160.jar:/home/dkfqs/controller/bin/DKFQSMeasuringAgent.jar;export CLASSPATH;nohup java -Xmx6144m -DdkfqsClusterControllerProperties=/home/dkfqs/controller/config/clustercontroller.properties -Dnashorn.args="--no-deprecation-warning" com.dkfqs.measuringagent.clustercontroller.StartDKFQSClusterController 1>/home/dkfqs/controller/log/ClusterController.log 2>&1 &'
;;
stop)
PID=`ps -o pid,args -e | grep "StartDKFQSClusterController" | egrep -v grep | awk '{print $1}'`
if [ ! -z "$PID" ] ; then
echo "ClusterController stopped with pid(s) : $PID"
kill -9 ${PID} 1> /dev/null 2>&1
fi
;;
status)
PID=`ps -o pid,args -e | grep "StartDKFQSClusterController" | egrep -v grep | awk '{print $1}'`
if [ ! -z "$PID" ] ; then
echo "ClusterController running with pid(s) : $PID"
else
echo "No ClusterController running"
fi
;;
*)
echo "Usage: /etc/init.d/ClusterController {start|stop|status}"
exit 1
;;
esac
exit 0
Change owner and file protection of /etc/init.d/ClusterController (root at /etc/init.d):
chown root ClusterController
chgrp root ClusterController
chmod 755 ClusterController
Register /etc/init.d/ClusterController to be started at system boot (root at /etc/init.d):
update-rc.d ClusterController defaults
Reboot the system. Login as dkfqs and check /home/dkfqs/controller/log/ClusterController.log


The Portal Server sends its emails via SMTP. You need an email server which receive and forward these SMTP messages.
If the Portal Server will be operated/configured in such a way that any person can “sign up” (= self registration) you need a customer account for the Twilio SMS Gateway www.twilio.com/docs/sms
In /etc/sysctl.conf add:
# TCP/IP Tuning
# =============
fs.file-max = 524288
net.ipv4.tcp_max_syn_backlog = 2048
net.ipv4.tcp_synack_retries = 3
net.ipv4.tcp_max_orphans = 65536
net.ipv4.tcp_fin_timeout = 30
net.ipv4.ip_local_port_range = 16384 60999
net.core.somaxconn = 256
net.core.rmem_max = 1048576
net.core.wmem_max = 1048576
In /etc/security/limits.conf add:
# TCP/IP Tuning
# =============
* soft nproc 262140
* hard nproc 262140
* soft nofile 262140
* hard nofile 262140
root soft nproc 262140
root hard nproc 262140
root soft nofile 262140
root hard nofile 262140
Enter: systemctl show -p TasksMax user-0
output: TasksMax=8966
if you get a value less than 262140 then add in /etc/systemd/system.conf
# Ubuntu Tuning
# =============
DefaultTasksMax=262140
Reboot the system and verify the settings. Enter: ulimit -n
output: 262140
Enter: systemctl show -p TasksMax user-0
output: TasksMax=262140
Install ifupdown
sudo apt-get update
sudo apt-get install ifupdown
Create/edit the file DKFQSiptables in /etc/network/if-pre-up.d/ and add:
#!/bin/sh
iptables -t nat -A PREROUTING -p tcp --dport 80 -j REDIRECT --to-port 8000
iptables -t nat -I OUTPUT -p tcp -d 127.0.0.1 --dport 80 -j REDIRECT --to-ports 8000
iptables -t nat -A PREROUTING -p tcp --dport 443 -j REDIRECT --to-port 8001
iptables -t nat -I OUTPUT -p tcp -d 127.0.0.1 --dport 443 -j REDIRECT --to-ports 8001
exit 0
Then give execute permission to /etc/network/if-pre-up.d/DKFQSiptables : sudo chmod 755 /etc/network/if-pre-up.d/DKFQSiptables
Reboot the machine and check with:
sudo iptables -L -t nat
> Chain PREROUTING (policy ACCEPT)
> target prot opt source destination
> REDIRECT tcp -- anywhere anywhere tcp dpt:http redir ports 8000
> REDIRECT tcp -- anywhere anywhere tcp dpt:https redir ports 8001
> REDIRECT tcp -- anywhere anywhere tcp dpt:http redir ports 8000
> REDIRECT tcp -- anywhere anywhere tcp dpt:https redir ports 8001
>
> Chain INPUT (policy ACCEPT)
> target prot opt source destination
>
> Chain OUTPUT (policy ACCEPT)
> target prot opt source destination
> REDIRECT tcp -- anywhere localhost tcp dpt:https redir ports 8001
> REDIRECT tcp -- anywhere localhost tcp dpt:http redir ports 8000
> REDIRECT tcp -- anywhere localhost tcp dpt:https redir ports 8001
> REDIRECT tcp -- anywhere localhost tcp dpt:http redir ports 8000
>
> Chain POSTROUTING (policy ACCEPT)
> target prot opt source destination
sudo apt-get update
sudo apt-get install fontconfig
sudo apt-get update
sudo apt-get install haveged
sudo apt-get update
sudo apt install sqlite
wget https://download.java.net/openjdk/jdk8u41/ri/openjdk-8u41-b04-linux-x64-14_jan_2020.tar.gz
wget https://download.java.net/java/GA/jdk11/13/GPL/openjdk-11.0.1_linux-x64_bin.tar.gz
gunzip openjdk-8u41-b04-linux-x64-14_jan_2020.tar.gz
tar -xvf openjdk-8u41-b04-linux-x64-14_jan_2020.tar
rm openjdk-8u41-b04-linux-x64-14_jan_2020.tar
sudo bash *******
mkdir /opt/OpenJDK
mv java-se-8u41-ri /opt/OpenJDK
cd /opt/OpenJDK
ls -al
chown root -R java-se-8u41-ri
chgrp root -R java-se-8u41-ri
exit # end sudo bash
Verify the Java 8 installation.
/opt/OpenJDK/java-se-8u41-ri/bin/java -version
openjdk version "1.8.0_41"
OpenJDK Runtime Environment (build 1.8.0_41-b04)
OpenJDK 64-Bit Server VM (build 25.40-b25, mixed mode)
gunzip openjdk-11.0.1_linux-x64_bin.tar.gz
tar -xvf openjdk-11.0.1_linux-x64_bin.tar
rm openjdk-11.0.1_linux-x64_bin.tar
sudo bash
mv jdk-11.0.1 /opt/OpenJDK
cd /opt/OpenJDK
ls -al
chown root -R jdk-11.0.1
chgrp root -R jdk-11.0.1
Execute the following commands (still as sudo bash):
update-alternatives --install "/usr/bin/java" "java" "/opt/OpenJDK/jdk-11.0.1/bin/java" 1
update-alternatives --install "/usr/bin/javac" "javac" "/opt/OpenJDK/jdk-11.0.1/bin/javac" 1
update-alternatives --install "/usr/bin/keytool" "keytool" "/opt/OpenJDK/jdk-11.0.1/bin/keytool" 1
update-alternatives --install "/usr/bin/jar" "jar" "/opt/OpenJDK/jdk-11.0.1/bin/jar" 1
update-alternatives --set "java" "/opt/OpenJDK/jdk-11.0.1/bin/java"
update-alternatives --set "javac" "/opt/OpenJDK/jdk-11.0.1/bin/javac"
update-alternatives --set "keytool" "/opt/OpenJDK/jdk-11.0.1/bin/keytool"
update-alternatives --set "jar" "/opt/OpenJDK/jdk-11.0.1/bin/jar"
exit # end sudo bash
Verify the Java 11 installation.
java -version
openjdk version "11.0.1" 2018-10-16
OpenJDK Runtime Environment 18.9 (build 11.0.1+13)
OpenJDK 64-Bit Server VM 18.9 (build 11.0.1+13, mixed mode)
sudo adduser dkfqs # follow the questions, remember or write down the password
Login with the dkfqs account (SSH) - or - Enter: sudo -u dkfqs bash | OR: Install Samba to get convenient access to /home/dkfqs as Samba dkfqs user
Create the directory /home/dkfqs/portal (as dkfqs user):
cd /home/dkfqs
mkdir portal
Create the following sub-directories at /home/dkfqs/agent (as dkfqs user):
cd /home/dkfqs/portal
mkdir backup bin config db developerExamples htdocs javaUsersLib jks log reportTemplate scripts temp usersLib usersData
Copy the following files to the bin directory /home/dkfqs/portal/bin
Copy the following files to the db directory /home/dkfqs/portal/db
Edit the file CreateNewUsersDB.sql and modify the following line to set the nickname, the email, the phone number and the temporary password of the Admin account. Note: The nickname must always start with “Admin-”
insert into AdminAccountsTable (adminUserId, nickname, adminPrimaryEmail, adminPrimaryPhone, initialPassword) values (1, "Admin-One", "falarasorn@yahoo.com", "+43123456789", "ginkao1234");
Navigate to /home/dkfqs/portal/db and create the Admin, Operations and the Users DB (as dkfqs user):
sqlite3 AdminAccounts.db < CreateNewAdminDB.sql
sqlite3 Monitoring.db < CreateNewMonitoringDB.sql
sqlite3 Operations.db < CreateNewOperationsDB.sql
sqlite3 Users.db < CreateNewUsersDB.sql
Copy the following file to the htdocs directory /home/dkfqs/portal/htdocs
Navigate to /home/dkfqs/portal/htdocs and execute (as dkfqs user):
jar -xvf htdocs.jar
rm htdocs.jar # delete the jar)
rm -R META-INF # delete the META-INF directory)
Copy the following files to the javaUsersLib directory /home/dkfqs/portal/javaUsersLib
Copy the following file to the jks directory /home/dkfqs/portal/jks
Copy the following files to the usersLib directory /home/dkfqs/portal/usersLib
Copy the following files to the bin directory /home/dkfqs/portal/reportTemplate
Copy the following files to the bin directory /home/dkfqs/portal/config
Modify the dkfqs.properties file. Set the following properties:
Example: dkfqs.properties
IsProduction=true
ServerName=192.168.0.50
ServerDNSName=192.168.0.50
DiskDocumentRootDirectory=/home/dkfqs/portal/htdocs
SQLiteDBDirectory=/home/dkfqs/portal/db
ReportTemplateDirectory=/home/dkfqs/portal/reportTemplate/
JasperReportsTemporaryDirectory=/home/dkfqs/portal/temp/
UsersDataRootDirectory=/home/dkfqs/portal/usersData
OSProcessLogFile=/home/dkfqs/portal/log/DKFQS.log
LogLevel=info
StaticContentMaxAgeTime=7200
MaxHTTPRequestSize=20240000
MaxInvalidAnonymousSessionsPerIPLimit=32
AnonymousSessionTimeout=1200
MaxAnonymousSessionTime=21600
MaxWebSocketConnectTimeSeconds=14400
MaxInboundWebSocketTrafficPerConnection=67108864
MaxInboundWebSocketPayloadPerFrame=1048576
MaxInboundWebSocketFramesPerIPTimeFrame=10
MaxInboundWebSocketFramesPerIPLimit=1000
HTTPExternalServerPort=80
HTTPInternalServerPort=8000
HTTPSExternalServerPort=443
HTTPSInternalServerPort=8001
HTTPSKeyStoreFile=/home/dkfqs/portal/jks/dkfqscom.jks
HTTPSKeyStorePassword=topsecret
#
FileTreeApiMaxRequestSizeMB=256
FileTreeApiWorkerThreadBusyTimeoutSeconds=330
FileTreeApiWorkerThreadExecutionTimeoutSeconds=300
TestjobsApiMaxRequestSizeMB=256
TestjobsApiWorkerThreadBusyTimeoutSeconds=330
TestjobsApiWorkerThreadExecutionTimeoutSeconds=300
#
DNSJavaDefaultDNSServers=8.8.8.8,8.8.4.4
#
JavaSDK8BinaryPath=/opt/OpenJDK/java-se-8u41-ri/bin
JavaSDK11BinaryPath=/opt/OpenJDK/jdk-11.0.1/bin
HTTPTestWizardJavaCodeLibraries=/home/dkfqs/portal/usersLib/com.dkfqs.tools.jar
#
UserSignInURL=/SignIn
UsersMailServerHost=192.168.1.4
UsersMailFrom=xxxxxxxxx@xxxxxxx.com
UsersMailServerAuthUser=xxxxxxxxx@xxxxxxx.com
UsersMailServerAuthPassword=*********
UsersMailTransmitterThreads=2
UsersMailDebugSMTP=false
#
smsGatewaysClassNames=com.dkfqs.server.sms.twilio.TwilioSMSGateway
#
# ServerStatusPageEnabledIPList=127.0.0.1,192.168.0.99
ServerStatusPageEnabledIPList=*.*.*.*
AdminSignInURL=/AdminSignIn
AlertMailEnabled=true
AlertMailServerHost=192.168.1.4
AlertMailFrom=xxxxxxxxx@xxxxxxx.com
AlertMailToList=yyyyyyyyy@xxxxxxx.com,zzzzzzzzz@xxxxxxx.com
AlertMailBounceAddress=bbbbbbb@xxxxxxx.com
AlertMailServerAuthUser=xxxxxxxxx@xxxxxxx.com
AlertMailServerAuthPassword=*******
AlertMailDebugSMTP=false
AlertMailNotifyStartup=false
#
SecurityIpBlacklistBlockTime=900
SecurityMaxRequestsPerIpLimit=200
SecurityMaxRequestsPerIpTimeFrame=10
SecurityMaxInvalidRequestsPerIpLimit=12
SecurityMaxInvalidRequestsPerIpTimeFrame=60
SecurityMaxAnonymousFormSubmitPerIpLimit=8
SecurityMaxAnonymousFormSubmitPerIpTimeFrame=60
SecurityMaxAuthenticationFailuresPerIpLimit=5
SecurityMaxAuthenticationFailuresPerIpTimeFrame=60
#
MeasuringAgentConnectTimeout=10
# Support of license provider 'Real Load Pty Ltd / nopCommerce', if enabled then the LicenseProviderRealLoadPtyLtdNopCommerceCARootFileName is located in the config directory of the portal server
LicenseProviderRealLoadPtyLtdNopCommerceEnabled=true
LicenseProviderRealLoadPtyLtdNopCommerceCARootFileName=nopCommerceCARoot.pem
# Synthetic Monitoring settings
MonitoringJobSchedulerMainThreadIntervalSeconds=10
MonitoringJobSchedulerInitialDBLogLevel=warn
MonitoringJobSchedulerInitialStdoutLogLevel=info
MonitoringJobSchedulerInitialUserFileLogLevel=info
MonitoringGroupThreadsStartDelayMillis=1000
# Support for compiling Junit and Selenium Tests
JavaUsersLibDirectory=/home/dkfqs/portal/javaUsersLib
JavaJUnit4CompilerLibraries=hamcrest-core-1.3.jar,junit-4.13.2.jar
JavaJUnit4TestExecutionLibraries=com.dkfqs.selenium.jar,com.dkfqs.tools.jar,commons-io-2.13.0.jar,hamcrest-core-1.3.jar,junit-4.13.2.jar
JavaSelenium4CompilerLibraries=hamcrest-core-1.3.jar,junit-4.13.2.jar,selenium_bundle-4.12.1.jar,com.dkfqs.selenium.jar
JavaSelenium4TestExecutionLibraries=selenium_bundle-4.12.1.jar,com.dkfqs.selenium.jar,com.dkfqs.tools.jar,commons-io-2.13.0.jar,hamcrest-core-1.3.jar,junit-4.13.2.jar
Modify the twilio.properties file. Set the following properties:
Example: twilio.properties
apiURLMainPath=https://api.twilio.com/2010-04-01/Accounts/
sid=********************************
authToken=********************************
fromTwilioPhoneNumber=+1123456789
fromTwilioAlphanumericSenderID=RealLoad
tcpConnectTimoutMillis=10000
sslHandshakeTimeoutMillis=5000
httpProcessingTimeoutMillis=10000
debugAPI=false
cd /home/dkfqs/portal/bin
export CLASSPATH=bcpkix-jdk15on-160.jar:bcprov-jdk15on-160.jar:bctls-jdk15on-160.jar:DKFQS.jar
java -Xmx2048m -DdkfqsProperties=../config/dkfqs.properties -DrewriteProperties=../config/rewrite.properties -Dnashorn.args="--no-deprecation-warning" com.dkfqs.server.internal.StartDKFQSserver
Internal RSA 2048 bit keypair generated in 1220 ms
2021-03-10 22:27:25.040 | QAHTTPd | INFO | SQL connection pool for DB "UsersDB" initialized
2021-03-10 22:27:25.062 | QAHTTPd | INFO | SQL connection pool for DB "AdminAccountsDB" initialized
2021-03-10 22:27:25.068 | QAHTTPd | INFO | Alarm adapter "IP Blacklist Alarm Adapter" started
2021-03-10 22:27:25.069 | QAHTTPd | WARN | QAHTTPd V1.3-U started
2021-03-10 22:27:25.071 | QAHTTPd | INFO | Execute PreUpStartupLoadIPRangeBlacklist
2021-03-10 22:27:25.082 | QAHTTPd | INFO | HTTP server starting at port 8000
2021-03-10 22:27:25.109 | QAHTTPd | INFO | HTTP server ready at port 8000
2021-03-10 22:27:25.110 | QAHTTPd | INFO | HTTPS server starting at port 8001
2021-03-10 22:27:25.124 | QAHTTPd | INFO | HTTPS server ready at port 8001
2021-03-10 22:27:25.821 | EMAIL-1 | INFO | Email transmitter thread started
2021-03-10 22:27:25.822 | EMAIL-2 | INFO | Email transmitter thread started
2021-03-10 22:27:25.828 | main | INFO | Twilio SMS Gateway registered
2021-03-10 22:27:25.853 | main | INFO | Twilio SMS Gateway initialized
2021-03-10 22:27:25.857 | SMS-Dispatcher | INFO | Thread started
sudo bash # become root
cd /etc/init.d
vi DKFQS
Edit - create /etc/init.d/DKFQS
#!/bin/sh
# /etc/init.d/DKFQS
# install with: update-rc.d DKFQS defaults
### BEGIN INIT INFO
# Provides: DKFQS
# Required-Start: $local_fs $network $time $syslog
# Required-Stop: $local_fs $network
# Default-Start: 2 3 4 5
# Default-Stop: 0 1 6
# Short-Description: Start DKFQS daemon at boot time
# Description: DKFQS daemon
### END INIT INFO
case "$1" in
start)
if [ -f /home/dkfqs/portal/log/DKFQS.log ]; then
mv /home/dkfqs/portal/log/DKFQS.log /home/dkfqs/portal/log/DKFQS.log_$(date +"%Y_%m_%d_%H_%M")
fi
sudo -H -u dkfqs bash -c 'CLASSPATH=/home/dkfqs/portal/bin/bcpkix-jdk15on-160.jar:/home/dkfqs/portal/bin/bcprov-jdk15on-160.jar:/home/dkfqs/portal/bin/bctls-jdk15on-160.jar:/home/dkfqs/portal/bin/jasperreports-fonts-6.20.5.jar:/home/dkfqs/portal/bin/DKFQS.jar;export CLASSPATH;cd /home/dkfqs/portal/temp;nohup java -Xmx3072m -DdkfqsProperties=/home/dkfqs/portal/config/dkfqs.properties -DrewriteProperties=/home/dkfqs/portal/config/rewrite.properties -Dnashorn.args="--no-deprecation-warning" com.dkfqs.server.internal.StartDKFQSserver 1>/home/dkfqs/portal/log/DKFQS.log 2>&1 &'
;;
stop)
PID=`ps -o pid,args -e | grep "StartDKFQSserver" | egrep -v grep | awk '{print $1}'`
if [ ! -z "$PID" ] ; then
echo "DKFQS stopped with pid(s) : $PID"
kill -9 ${PID} 1> /dev/null 2>&1
fi
;;
status)
PID=`ps -o pid,args -e | grep "StartDKFQSserver" | egrep -v grep | awk '{print $1}'`
if [ ! -z "$PID" ] ; then
echo "DKFQS running with pid(s) : $PID"
else
echo "No DKFQS running"
fi
;;
*)
echo "Usage: /etc/init.d/DKFQS {start|stop|status}"
exit 1
;;
esac
exit 0
Change owner and file protection of /etc/init.d/DKFQS (root at /etc/init.d):
chown root DKFQS
chgrp root DKFQS
chmod 755 DKFQS
Register /etc/init.d/DKFQS to be started at system boot (root at /etc/init.d):
update-rc.d DKFQS defaults
Reboot the system. Then check /home/dkfqs/portal/log/DKFQS.log
Enter in your browser https://admin-portal-host/admin .
You will get a browser warning because the SSL server certificate is expired. Ignore the warning and enter in the Sign In the email address and the password as you have set in CreateNewAdminDB.sql.
You will now asked to set a new password. Then you are signed in.

Disable Sign Up if you don’t have an SMS gateway:

User accounts can be added directly:

If you or your company can already issue SSL server certificates you can skip the next sub-chapter. Continue in such a case with “Convert and Install the SSL Server Certificate”.
Make sure that your portal server has a public, valid DNS name.
Install certbot:
sudo snap install --classic certbot
sudo ln -s /snap/bin/certbot /usr/bin/certbot
Stop the Portal Server:
sudo /etc/init.d/DKFQS stop
To get the SSL server certificate enter:
sudo certbot certonly --standalone # enter your email address and the DNS name ou your portal server, follow the instructions
On success certbot generates the following two files:
Start the Portal Server:
sudo /etc/init.d/DKFQS start
Become root and navigate to the directory where the fullchain.pem and privkey.pem files are located. Enter:
sudo bash
openssl pkcs12 -export -in fullchain.pem -inkey privkey.pem -out your-certificate-name.p12 # convert cert to PKCS12 file
keytool -importkeystore -srckeystore your-certificate-name.p12 -srcstoretype PKCS12 -destkeystore your-certificate-name.jks -deststoretype JKS # convert PKCS12 file to Java keystore file
Copy the Java keystore file to /home/dkfqs/portal/jks
cp your-certificate-name.jks /home/dkfqs/portal/jks
Edit /home/dkfqs/portal/config/dkfqs.properties and replace:
HTTPSKeyStoreFile=/home/dkfqs/portal/jks/your-certificate-name.jks
HTTPSKeyStorePassword=*********
Restart the Portal Server
sudo /etc/init.d/DKFQS stop
sudo /etc/init.d/DKFQS start
Create at your home directory the sub-directory system_cronjobs_scripts and add/edit the file “DKFQS_certbot_renew” in this directory. Replace the ********* placeholders with your real values.
#!/bin/sh
#
# renew the letsencrypt DKFQS certificate
# =======================================
certbot renew
#
# set the default working directory
cd /home/*********/system_cronjobs_scripts
#
# cleanup in any case
rm -f *.jks
rm -f *.p12
#
# convert the letsencrypt certificate to PKCS12 and place it in the default directory
openssl pkcs12 -export -in /etc/letsencrypt/live/*********/fullchain.pem -inkey /etc/letsencrypt/live/*********/privkey.pem -out ./*********.p12 -passin pass:******** -passout pass:********
#
# convert the PKCS12 certificate to a Java keystore
echo ******** | keytool -importkeystore -srckeystore *********.p12 -srcstoretype PKCS12 -destkeystore *********.jks -deststoretype JKS -storepass ********
#
# update DKFQS keystore file
cp *********.jks /home/dkfqs/portal/jks
chown dkfqs /home/dkfqs/portal/jks/*********.jks
chgrp dkfqs /home/dkfqs/portal/jks/*********.jks
chmod 600 /home/dkfqs/portal/jks/*********.jks
#
# restart DKFQS server
/etc/init.d/DKFQS stop
sleep 5
sudo /etc/init.d/DKFQS start
#
# cleanup again in any case
rm -f *.jks
rm -f *.p12
#
# display DKFQS log file
sleep 5
cat /home/dkfqs/portal/log/DKFQS.log
#
# all done
exit 0
sudo bash # become root
chmod 700 DKFQS_certbot_renew # change file protection and set execute bit
./DKFQS_certbot_renew # try out manually
Add the file to crontab. Important: The last line in crontab must be an empty line!
sudo crontab -e
1 1 1 * * /home/*********/system_cronjobs_scripts/DKFQS_certbot_renew > /home/*********/system_cronjobs_scripts/DKFQS_certbot_renew.log 2>&1
The Remote Proxy Recorder can be placed at any network location, but the control port must be reachable from the Portal Server.
In /etc/sysctl.conf add:
# TCP/IP Tuning
# =============
fs.file-max = 524288
net.ipv4.tcp_max_syn_backlog = 2048
net.ipv4.tcp_synack_retries = 3
net.ipv4.tcp_max_orphans = 65536
net.ipv4.tcp_fin_timeout = 30
net.ipv4.ip_local_port_range = 16384 60999
net.core.somaxconn = 256
net.core.rmem_max = 1048576
net.core.wmem_max = 1048576
in /etc/security/limits.conf add:
# TCP/IP Tuning
# =============
* soft nproc 262140
* hard nproc 262140
* soft nofile 262140
* hard nofile 262140
root soft nproc 262140
root hard nproc 262140
root soft nofile 262140
root hard nofile 262140
Enter: systemctl show -p TasksMax user-0
output: TasksMax=8966
if you get a value less than 262140 then add in /etc/systemd/system.conf
# Ubuntu Tuning
# =============
DefaultTasksMax=262140
Reboot the system and verify the settings. Enter: ulimit -n
output: 262140
Enter: systemctl show -p TasksMax user-0
output: TasksMax=262140
sudo apt-get update
sudo apt-get install haveged
wget https://download.java.net/java/GA/jdk11/13/GPL/openjdk-11.0.1_linux-x64_bin.tar.gz
gunzip openjdk-11.0.1_linux-x64_bin.tar.gz
tar -xvf openjdk-11.0.1_linux-x64_bin.tar
rm openjdk-11.0.1_linux-x64_bin.tar
sudo bash
mv jdk-11.0.1 /opt/OpenJDK
cd /opt/OpenJDK
ls -al
chown root -R jdk-11.0.1
chgrp root -R jdk-11.0.1
Execute the following commands (still as sudo bash):
update-alternatives --install "/usr/bin/java" "java" "/opt/OpenJDK/jdk-11.0.1/bin/java" 1
update-alternatives --install "/usr/bin/javac" "javac" "/opt/OpenJDK/jdk-11.0.1/bin/javac" 1
update-alternatives --install "/usr/bin/keytool" "keytool" "/opt/OpenJDK/jdk-11.0.1/bin/keytool" 1
update-alternatives --install "/usr/bin/jar" "jar" "/opt/OpenJDK/jdk-11.0.1/bin/jar" 1
update-alternatives --set "java" "/opt/OpenJDK/jdk-11.0.1/bin/java"
update-alternatives --set "javac" "/opt/OpenJDK/jdk-11.0.1/bin/javac"
update-alternatives --set "keytool" "/opt/OpenJDK/jdk-11.0.1/bin/keytool"
update-alternatives --set "jar" "/opt/OpenJDK/jdk-11.0.1/bin/jar"
exit # end sudo bash
Verify the Java 11 installation.
java -version
openjdk version "11.0.1" 2018-10-16
OpenJDK Runtime Environment 18.9 (build 11.0.1+13)
OpenJDK 64-Bit Server VM 18.9 (build 11.0.1+13, mixed mode)
For technical reasons, the Remote Proxy Recorder generates “fake” web server certificates during operation in order to break the encryption between the web browser and the web servers and to record the data exchanged.
In order for this to work, the Remote Proxy Recorder needs its own CA root certificate, which you then have to import into your browser.
Thus for security reasons, never use a CA root certificate from us or someone else for the Remote Proxy Recorder root certificate. Always create your own CA root certificate.
Example:
C:\Scratch2>openssl genrsa -des3 -out myCAPrivate.key 2048
Generating RSA private key, 2048 bit long modulus
.......................+++
.............................+++
unable to write 'random state'
e is 65537 (0x10001)
Enter pass phrase for myCAPrivate.key:
Verifying - Enter pass phrase for myCAPrivate.key:
C:\Scratch2>openssl pkcs8 -topk8 -inform PEM -outform PEM -in myCAPrivate.key -out myCAPrivateKey.pem -nocrypt
Enter pass phrase for myCAPrivate.key:
C:\Scratch2>openssl req -x509 -new -nodes -key myCAPrivate.key -sha256 -days 3700 -out myCARootCert.pem
Enter pass phrase for myCAPrivate.key:
You are about to be asked to enter information that will be incorporated
into your certificate request.
What you are about to enter is what is called a Distinguished Name or a DN.
There are quite a few fields but you can leave some blank
For some fields there will be a default value,
If you enter '.', the field will be left blank.
-----
Country Name (2 letter code) [AU]:CH
State or Province Name (full name) [Some-State]:Bern
Locality Name (eg, city) []:Bern
Organization Name (eg, company) [Internet Widgits Pty Ltd]:My Pty Ltd
Organizational Unit Name (eg, section) []:QA
Common Name (e.g. server FQDN or YOUR name) []:DKFQS Proxy Recorder Root
Email Address []:
C:\Scratch2>dir
Volume in drive C is OS
Volume Serial Number is AEF7-CFB1
Directory of C:\Scratch2
06 Feb 2022 20:44 <DIR> .
06 Feb 2022 20:44 <DIR> ..
06 Feb 2022 20:40 1.743 myCAPrivate.key
06 Feb 2022 20:41 1.704 myCAPrivateKey.pem
06 Feb 2022 20:44 1.350 myCARootCert.pem
3 File(s) 4.797 bytes
2 Dir(s) 310.772.580.352 bytes free
sudo adduser dkfqs # follow the questions, remember or write down the password
Login with the dkfqs account (SSH) - or - Enter: sudo -u dkfqs bash | OR: Install Samba to get convenient access to /home/dkfqs as Samba dkfqs user
Create the directory /home/dkfqs/proxy (as dkfqs user):
cd /home/dkfqs
mkdir proxy
Create the following sub-directories at /home/dkfqs/proxy (as dkfqs user):
cd /home/dkfqs/proxy
mkdir bin config log
Copy the following files to the bin directory /home/dkfqs/proxy/bin
Copy the following files to the config directory /home/dkfqs/proxy/config
Modify the config.properties file. Set (modify) the following properties:
ControlServerLogLevel=info
ControlServerHttpsPort=8081
ControlServerHttpsCertificateCN=proxy2.realload.com
ControlServerHttpsCertificateIP=83.150.39.45
#Note: the control server authentication token is required to connect to the control server
ControlServerAuthToken=krungthep
ProxyServerLogLevel=warn
ProxyServerPort=8082
ProxyServerDefaultCaRootCertFilePath=/home/dkfqs/proxy/config/myCARootCert.pem
ProxyServerDefaultCaRootPrivateKeyFilePath=/home/dkfqs/proxy/config/myCAPrivateKey.pem
#Note: the proxy authentication credentials are replaced on the fly when the portal user connects via the control interface to the control server
ProxyServerDefaultAuthenticationUsername=max
ProxyServerDefaultAuthenticationPassword=meier
cd /home/dkfqs/proxy/bin
export CLASSPATH=bcmail-jdk15on-168.jar:bcpg-jdk15on-168.jar:bcpkix-jdk15on-168.jar:bcprov-jdk15on-168.jar:bctls-jdk15on-168.jar:com.dkfqs.remoteproxyrecorder.jar
java -Xmx2048m -DconfigProperties=../config/config.properties -Dnashorn.args="--no-deprecation-warning" com.dkfqs.remoteproxyrecorder.main.StartRemoteProxyRecorder
> Remote Proxy Recorder V0.2.0
> Max. Memory = 2048 MB
> Internal RSA 2048 bit keypair generated in 85 ms
> 2021-06-05 23:24:37.710 | QAHTTPd | WARN | QAHTTPd V1.3-V started
> 2021-06-05 23:24:37.710 | QAHTTPd | INFO | HTTPS server starting at port 8081
> 2021-06-05 23:24:37.726 | QAHTTPd | INFO | HTTPS server ready at port 8081
> 2021-06-05 23:24:38.722 | Proxy | WARN | ProxyRecorder V1.1.0 started at port 8082
sudo bash # become root
cd /etc/init.d
vi RemoteProxyRecorder
Edit - create /etc/init.d/RemoteProxyRecorder
#!/bin/sh
# /etc/init.d/RemoteProxyRecorder
# install with: update-rc.d RemoteProxyRecorder defaults
### BEGIN INIT INFO
# Provides: RemoteProxyRecorder
# Required-Start: $local_fs $network $time $syslog
# Required-Stop: $local_fs $network
# Default-Start: 2 3 4 5
# Default-Stop: 0 1 6
# Short-Description: Start RemoteProxyRecorder daemon at boot time
# Description: RemoteProxyRecorder daemon
### END INIT INFO
case "$1" in
start)
if [ -f /home/dkfqs/proxy/log/RemoteProxyRecorder.log ]; then
mv /home/dkfqs/proxy/log/RemoteProxyRecorder.log /home/dkfqs/proxy/log/RemoteProxyRecorder.log_$(date +"%Y_%m_%d_%H_%M")
fi
sudo -H -u dkfqs bash -c 'CLASSPATH=/home/dkfqs/proxy/bin/bcmail-jdk15on-168.jar:/home/dkfqs/proxy/bin/bcpg-jdk15on-168.jar:/home/dkfqs/proxy/bin/bcpkix-jdk15on-168.jar:/home/dkfqs/proxy/bin/bcprov-jdk15on-168.jar:/home/dkfqs/proxy/bin/bctls-jdk15on-168.jar:/home/dkfqs/proxy/bin/com.dkfqs.remoteproxyrecorder.jar;export CLASSPATH;nohup java -Xmx4096m -DconfigProperties=/home/dkfqs/proxy/config/config.properties -Dnashorn.args="--no-deprecation-warning" com.dkfqs.remoteproxyrecorder.main.StartRemoteProxyRecorder 1>/home/dkfqs/proxy/log/RemoteProxyRecorder.log 2>&1 &'
;;
stop)
PID=`ps -o pid,args -e | grep "StartRemoteProxyRecorder" | egrep -v grep | awk '{print $1}'`
if [ ! -z "$PID" ] ; then
echo "RemoteProxyRecorder stopped with pid(s) : $PID"
kill -9 ${PID} 1> /dev/null 2>&1
fi
;;
status)
PID=`ps -o pid,args -e | grep "StartRemoteProxyRecorder" | egrep -v grep | awk '{print $1}'`
if [ ! -z "$PID" ] ; then
echo "RemoteProxyRecorder running with pid(s) : $PID"
else
echo "No RemoteProxyRecorder running"
fi
;;
*)
echo "Usage: /etc/init.d/RemoteProxyRecorder {start|stop|status}"
exit 1
;;
esac
exit 0
Change owner and file protection of /etc/init.d/RemoteProxyRecorder (root at /etc/init.d):
chown root RemoteProxyRecorder
chgrp root RemoteProxyRecorder
chmod 755 RemoteProxyRecorder
Register /etc/init.d/RemoteProxyRecorder to be started at system boot (root at /etc/init.d):
update-rc.d RemoteProxyRecorder defaults
Reboot the system. Login as dkfqs and check /home/dkfqs/proxy/log/RemoteProxyRecorder.log

