This is the blog section. It has two categories: News and Releases.
Files in these directories will be listed in reverse chronological order.
This is the multi-page printable view of this section. Click here to print.
This is the blog section. It has two categories: News and Releases.
Files in these directories will be listed in reverse chronological order.
An exciting set of new features was added in Real Load v4.8.24. Test Templates and Test Suites.
Test Templates allow you to:
Test Suites will allow you to:
Once a Test Suite has been executed you can:
Test Suites allow you to implement regression testing by executing a specific set of performance tests using the very same execution parameters. You can even automate execution of Test Suites by triggering it via the APIs exposed by the product.
All of this is documented in this short video (9 minutes) which walks you through these new features.
As always, feedback or questions are welcome using our contact form.
Last week I wrote an article to illustrate how the ability to execute JUnit tests opens a whole new world of synthetic monitoring possibilities.
This week I’ve implemented another use case to detect SSL certificate related issues which I’ve actually seen causing issues in production environments. Most issues were were caused by expired certificates or CRLs, affecting websites, APIs or VPNs.
I’ve implemented a series of JUnit tests to verify these attributes of an SSL endpoint:
Below you’ll find the JUnit code to implement the above tests. Once the code is deployed to the Real Load platform you can configure a Synthetic Monitoring task to execute it regularly.
The code is intended for demonstration purposes only. Actual production code could be enhanced to perform additional checks on the presented SSL certificates or the other certs in the keychain. The code could also be extended to retrieve a list of SSL endpoints to be validated from a document or an API of some sort, to simplify maintenance.
Happy monitoring!
    <dependencies>
        <dependency>
            <groupId>junit</groupId>
            <artifactId>junit</artifactId>
            <version>4.12</version>
        </dependency>
        <dependency>
            <groupId>com.dkfqs.tools</groupId>
            <artifactId>tools</artifactId>
            <version>4.8.23</version>
        </dependency>
        <dependency>
            <groupId>org.bouncycastle</groupId>
            <artifactId>bcpkix-jdk15to18</artifactId>
            <version>1.68</version>
            <type>jar</type>
        </dependency>
This is the code implementing the SSL checks mentioned above. You’ll notice a few variables at the top to set hostname, port and some other configuration parameters…
import com.dkfqs.tools.crypto.EncryptedSocket;
import com.dkfqs.tools.javatest.AbstractJUnitTest;
import static com.dkfqs.tools.javatest.AbstractJUnitTest.isArgDebugExecution;
import static com.dkfqs.tools.logging.LogAdapterInterface.LOG_DEBUG;
import static com.dkfqs.tools.logging.LogAdapterInterface.LOG_ERROR;
import com.dkfqs.tools.logging.MemoryLogAdapter;
import org.junit.After;
import org.junit.Before;
import org.junit.Test;
import javax.net.ssl.SSLSocket;
import java.io.ByteArrayInputStream;
import java.io.DataInputStream;
import java.net.URL;
import java.net.URLConnection;
import java.security.cert.Certificate;
import java.security.cert.CertificateFactory;
import java.security.cert.X509CRL;
import java.security.cert.X509CRLEntry;
import java.security.cert.X509Certificate;
import java.util.ArrayList;
import java.util.Arrays;
import java.util.Calendar;
import java.util.Date;
import java.util.List;
import junit.framework.TestCase;
import org.bouncycastle.asn1.ASN1InputStream;
import org.bouncycastle.asn1.ASN1Primitive;
import org.bouncycastle.asn1.DERIA5String;
import org.bouncycastle.asn1.DEROctetString;
import org.bouncycastle.asn1.x509.CRLDistPoint;
import org.bouncycastle.asn1.x509.DistributionPoint;
import org.bouncycastle.asn1.x509.DistributionPointName;
import org.bouncycastle.asn1.x509.Extension;
import org.bouncycastle.asn1.x509.GeneralName;
import org.bouncycastle.asn1.x509.GeneralNames;
import org.bouncycastle.cert.jcajce.JcaX509CertificateHolder;
import org.junit.Assert;
import org.junit.Ignore;

public class TestSSLPort extends AbstractJUnitTest {

    private final static int TCP_CONNECT_TIMEOUT_MILLIS = 3000;
    private final static int SSL_HANDSHAKE_TIMEOUT_MILLIS = 2000;
    private String sslEndPoint = "www.realload.com"; // The SSL endpoint to validate
    private String DNofCertWithCRLdistPoint ="R3"; // The DN of the issuing CA - Used for CRL checks
    private int certExpirationDaysAlertThreshold = -30; //How many days before cert expiration we should be alerted.
    private int crlExpirationDaysAlertThreshold = -2; //How many days before CRL expiration we should be alerted.
    private final MemoryLogAdapter log = new MemoryLogAdapter();  // default log level is LOG_INFO

    @Before
    public void setUp() throws Exception {
        if (isArgDebugExecution()) {
            log.setLogLevel(LOG_DEBUG);
        }
        //log.setLogLevel(LOG_DEBUG);

        openAllPurposeInterface();
        log.message(LOG_DEBUG, "Testing SSL enpoint " + sslEndPoint + ":" + sslEndpointPort);
    }

    @Test
    public void CheckForWeakCipherSuites() throws Exception {
        SSLSocket sslSocket = SSLConnect(sslEndPoint, sslEndpointPort);
        String[] cipherSuites = sslSocket.getEnabledCipherSuites();
        // Add all weak ciphers here....
        TestCase.assertNotNull(cipherSuites);
        TestCase.assertFalse(Arrays.asList(cipherSuites).contains("SSL_RSA_WITH_DES_CBC_SHA"));
        TestCase.assertFalse(Arrays.asList(cipherSuites).contains("SSL_DHE_DSS_WITH_DES_CBC_SHA"));
        sslSocket.close();
    }

    @Test
    public void CheckForWeakSSLProtocols() throws Exception {
        SSLSocket sslSocket = SSLConnect(sslEndPoint, sslEndpointPort);
        String[] sslProtocols = sslSocket.getEnabledProtocols();
        TestCase.assertNotNull(sslProtocols);
        TestCase.assertFalse(Arrays.asList(sslProtocols).contains("TLSv1.0"));
        TestCase.assertFalse(Arrays.asList(sslProtocols).contains("TLSv1.1"));
        sslSocket.close();
    }

    @Test
    public void CheckCertExpiration30Days() throws Exception {
        SSLSocket sslSocket = SSLConnect(sslEndPoint, sslEndpointPort);
        TestCase.assertNotNull(sslSocket);
        Certificate[] peerCerts = sslSocket.getSession().getPeerCertificates();
        for (Certificate cert : peerCerts) {
            if (cert instanceof X509Certificate) {
                X509Certificate x = (X509Certificate) cert;
                if (x.getSubjectDN().toString().contains(sslEndPoint)) {
                    JcaX509CertificateHolder certAttrs = new JcaX509CertificateHolder(x);
                    Date expDate = certAttrs.getNotAfter();
                    log.message(LOG_DEBUG, "Cert expiration: " + expDate + " " + sslEndPoint);
                    Calendar c = Calendar.getInstance();
                    c.setTime(expDate);
                    c.add(Calendar.DATE, certExpirationDaysAlertThreshold);
                    if (new Date().after(c.getTime())) {
                        log.message(LOG_ERROR, "Cert expiration: " + expDate + ". Less than " + certExpirationDaysAlertThreshold + "days in future");
                        Assert.assertEquals(true, false);
                    }
                }
            }
        }
        sslSocket.close();
    }

    @Test
    public void CheckCRLRevocationStatus() throws Exception {
        SSLSocket sslSocket = SSLConnect(sslEndPoint, sslEndpointPort);
        TestCase.assertNotNull(sslSocket);
        Certificate[] peerCerts = sslSocket.getSession().getPeerCertificates();
        for (Certificate cert : peerCerts) {
            if (cert instanceof X509Certificate) {
                X509Certificate certToBeVerified = (X509Certificate) cert;
                if (certToBeVerified.getSubjectDN().toString().contains(DNofCertWithCRLdistPoint)) {
                    checkCRLRevocationStatus(certToBeVerified);
                }
            }
        }
        sslSocket.close();
    }

    @Test
    public void CheckCRLUpdateDueLess2Days() throws Exception {
        SSLSocket sslSocket = SSLConnect(sslEndPoint, sslEndpointPort);
        TestCase.assertNotNull(sslSocket);
        Certificate[] peerCerts = sslSocket.getSession().getPeerCertificates();
        for (Certificate cert : peerCerts) {
            if (cert instanceof X509Certificate) {
                X509Certificate certToBeVerified = (X509Certificate) cert;
                if (certToBeVerified.getSubjectDN().toString().contains(DNofCertWithCRLdistPoint)) {
                    checkCRLUpdateDueLessXDays(certToBeVerified);
                }
            }
        }
        sslSocket.close();
    }

    @After
    public void tearDown() throws Exception {
        closeAllPurposeInterface();
        log.writeToStdoutAndClear();
    }

    private static SSLSocket SSLConnect(String host, int port) throws Exception {
        EncryptedSocket encryptedSocket = new EncryptedSocket(host, port);
        encryptedSocket.setTCPConnectTimeoutMillis(TCP_CONNECT_TIMEOUT_MILLIS);
        encryptedSocket.setSSLHandshakeTimeoutMillis(SSL_HANDSHAKE_TIMEOUT_MILLIS);
        SSLSocket sslSocket = encryptedSocket.connect();
        return sslSocket;
    }

    private void checkCRLRevocationStatus(X509Certificate certificate) throws Exception {

        List<String> crlUrls = getCRLDistributionEndPoints(certificate);
        CertificateFactory cf;
        cf = CertificateFactory.getInstance("X509");

        // Loop through all CRL distribution enpoints
        for (String urlS : crlUrls) {
            log.message(LOG_DEBUG, "CRL endpoint: " + urlS);
            URL url = new URL(urlS);
            URLConnection connection = url.openConnection();
            X509CRL crl = null;
            try (DataInputStream inStream = new DataInputStream(connection.getInputStream())) {
                crl = (X509CRL) cf.generateCRL(inStream);
            }
            X509CRLEntry revokedCertificate = crl.getRevokedCertificate(certificate.getSerialNumber());

            if (revokedCertificate != null) {
                log.message(LOG_DEBUG, "Revoked");
                Assert.assertEquals(true, false);
            } else {
                log.message(LOG_DEBUG, "Valid");
            }
        }
    }

    private void checkCRLUpdateDueLessXDays(X509Certificate certificate) throws Exception {
        List<String> crlUrls = getCRLDistributionEndPoints(certificate);
        CertificateFactory cf;
        cf = CertificateFactory.getInstance("X509");

        // Loop through all CRL distribution enpoints
        for (String urlS : crlUrls) {
            log.message(LOG_DEBUG, "CRL endpoint: " + urlS);
            URL url = new URL(urlS);
            URLConnection connection = url.openConnection();
            X509CRL crl = null;
            try (DataInputStream inStream = new DataInputStream(connection.getInputStream())) {
                crl = (X509CRL) cf.generateCRL(inStream);
            }
            Date nextUpdateDueBy = crl.getNextUpdate();
            log.message(LOG_DEBUG, "CRL Next Update: " + nextUpdateDueBy + " " + urlS);
            Calendar c = Calendar.getInstance();
            c.setTime(nextUpdateDueBy);
            c.add(Calendar.DATE, crlExpirationDaysAlertThreshold);
            if (new Date().after(c.getTime())) {
                log.message(LOG_ERROR, "CRL " + urlS + " expiration: " + nextUpdateDueBy + ". Less than " + crlExpirationDaysAlertThreshold + " days in future");
                Assert.assertEquals(true, false);
            }
        }
    }

    private List<String> getCRLDistributionEndPoints(X509Certificate certificate) throws Exception {
        byte[] crlDistributionPointDerEncodedArray = certificate.getExtensionValue(Extension.cRLDistributionPoints.getId());

        ASN1InputStream oAsnInStream = new ASN1InputStream(new ByteArrayInputStream(crlDistributionPointDerEncodedArray));
        ASN1Primitive derObjCrlDP = oAsnInStream.readObject();
        DEROctetString dosCrlDP = (DEROctetString) derObjCrlDP;
        oAsnInStream.close();

        byte[] crldpExtOctets = dosCrlDP.getOctets();
        ASN1InputStream oAsnInStream2 = new ASN1InputStream(new ByteArrayInputStream(crldpExtOctets));
        ASN1Primitive derObj2 = oAsnInStream2.readObject();
        CRLDistPoint distPoint = CRLDistPoint.getInstance(derObj2);
        oAsnInStream2.close();

        List<String> crlUrls = new ArrayList<String>();
        for (DistributionPoint dp : distPoint.getDistributionPoints()) {
            DistributionPointName dpn = dp.getDistributionPoint();
            // Look for URIs in fullName
            if (dpn != null) {
                if (dpn.getType() == DistributionPointName.FULL_NAME) {
                    GeneralName[] genNames = GeneralNames.getInstance(dpn.getName()).getNames();
                    // Look for an URI
                    for (int j = 0; j < genNames.length; j++) {
                        if (genNames[j].getTagNo() == GeneralName.uniformResourceIdentifier) {
                            String url = DERIA5String.getInstance(genNames[j].getName()).getString();
                            crlUrls.add(url);
                        }
                    }
                }
            }
        }
        return crlUrls;
    }

}
P.S: Some of the code above was inspired from this Stack Overflow post.
Version 8.4.23 of the Real Load platform expose new API methods that allow triggering Load Test scripts programmatically, via REST API calls. This enhancement is quite important, as it allows you to automate performance test execution as part of build processes, etc…
Another use case would be to regularly execute performance test to maintain data volume in application databases. One of the applications I work with (Outseer’s Fraud Manager on Premise) has got internal housekeeping processes that over time will remove runtime data from its DB. While this is to be expected, it might be detrimental to environments to be used for performance testing, where you might want to simulate production like data volume, or at least maintain data to a specific size.
In this case, a good way to maintain the application data volume to a given size would be to simulate on a daily basis the same number of transactions that actually occur in production environment, by simulating a similar volume of API calls.
In this blog post I’ll illustrate with a simple PowerShell example how you can automate execution of a Real Load performance test using the newly exposed API methods.
As you can see in the v4.8.23 release notes, Real Load now exposes these new API methods:
Before getting started with the script, you’ll need to:
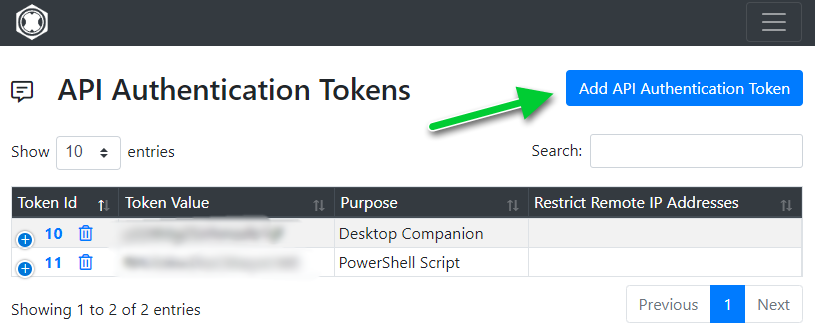
Obtain the API authentication token from the Real Load portal:
Configure a Load Testing template and note its ID
In the Load Test Jobs menu, look for a recently load test job that you’d like to trigger via the new APIs. To create a template from it, select the item pointed out in the screenshot:
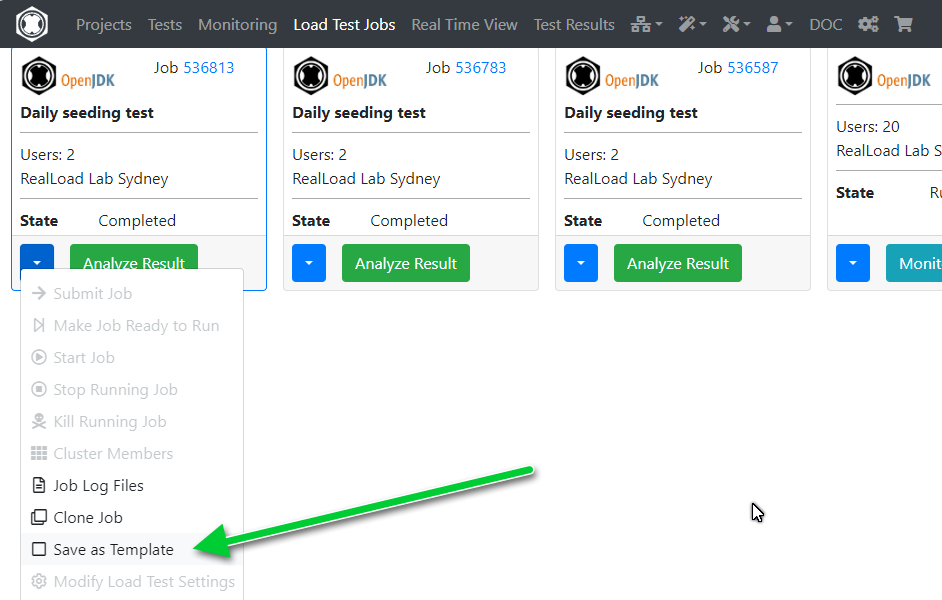
… as shown in this screenshot.
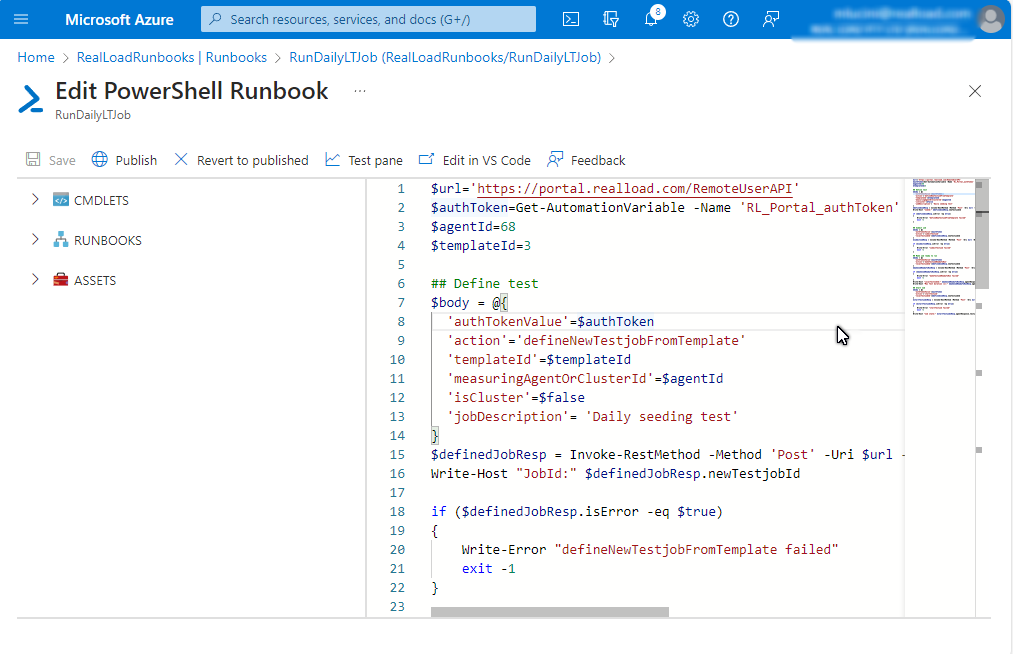
The next step involves preparing a script to invoke the Real Load API methods to trigger the test. I’ve used the following PowerShell script, which I’ll execute regularly as an Azure RunBook.
We’ll use 4 API methods:
You’ll need to change the value of the agentId and templateId variables as needed. If you’re planning to run this script from an on-premises scheduler then you can hardcode the authToken value, instead of invoking Get-AutomationVariable.
$url='https://portal.realload.com/RemoteUserAPI'
$authToken=Get-AutomationVariable -Name 'RL_Portal_authToken'
$agentId=78
$templateId=787676

## Define test
$body = @{
  'authTokenValue'=$authToken
  'action'='defineNewTestjobFromTemplate'
  'templateId'=$templateId
  'measuringAgentOrClusterId'=$agentId
  'isCluster'=$false
  'jobDescription'= 'Daily seeding test'
}
$definedJobResp = Invoke-RestMethod -Method 'Post' -Uri $url -Body ($body|ConvertTo-Json) -ContentType "application/json"
Write-Host "JobId:" $definedJobResp.newTestjobId

if ($definedJobResp.isError -eq $true)
{
    Write-Error "defineNewTestjobFromTemplate failed"
    exit -1
}


## Submit job
$body = @{
  'authTokenValue'=$authToken
  'action'='submitTestjob'
  'localTestjobId'=$definedJobResp.newTestjobId
}
$submitJobResp = Invoke-RestMethod -Method 'Post' -Uri $url -Body ($body|ConvertTo-Json) -ContentType "application/json"

if ($submitJobResp.isError -eq $true)
{
    Write-Error "submitTestjob failed"
    exit -1
}

## Make job ready to run
$body = @{
  'authTokenValue'=$authToken
  'action'='makeTestjobReadyToRun'
  'localTestjobId'=$definedJobResp.newTestjobId
}
$makeJobReadyToRunResp = Invoke-RestMethod -Method 'Post' -Uri $url -Body ($body|ConvertTo-Json) -ContentType "application/json"

if ($makeJobReadyToRunResp.isError -eq $true)
{
    Write-Error "makeTestjobReadyToRun failed"
    exit -1
}
Write-Host "LocalTestJobId:" $makeJobReadyToRunResp.agentResponse.testjobProperties.localTestjobId
Write-Host "Max Test duration (s):" $makeJobReadyToRunResp.agentResponse.testjobProperties.testjobMaxTestDuration

## Start Job
$body = @{
  'authTokenValue'=$authToken
  'action'='startTestjob'
  'localTestjobId'=$definedJobResp.newTestjobId
}
$startTestjobnResp = Invoke-RestMethod -Method 'Post' -Uri $url -Body ($body|ConvertTo-Json) -ContentType "application/json"

if ($startTestjobnResp.isError -eq $true)
{
    Write-Error "startTestjob failed"
    exit -1
}
Write-Host "Job state:" $startTestjobnResp.agentResponse.testjobProperties.testjobState
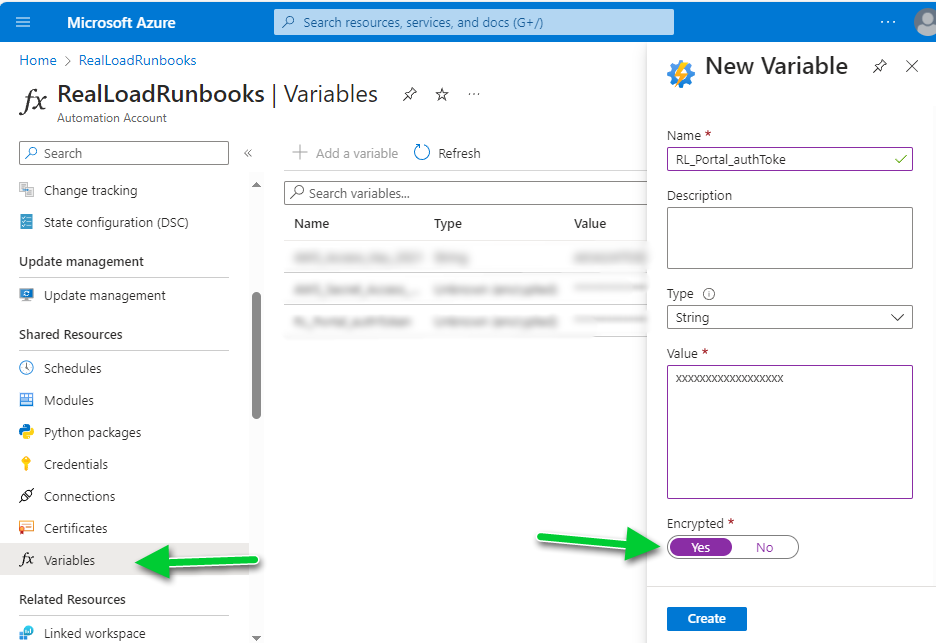
Configure an Azure RunBook variable by the same name as used in the powershell script, in this example “RL_Portal_authToken”. Make sure you set the type to String and select the “Encrypted” flag.
Now create a new RunBook of type PowerShell and copy and paste the above code in it. Use the “Test pane” to test execution and when successfully tested save and publish.
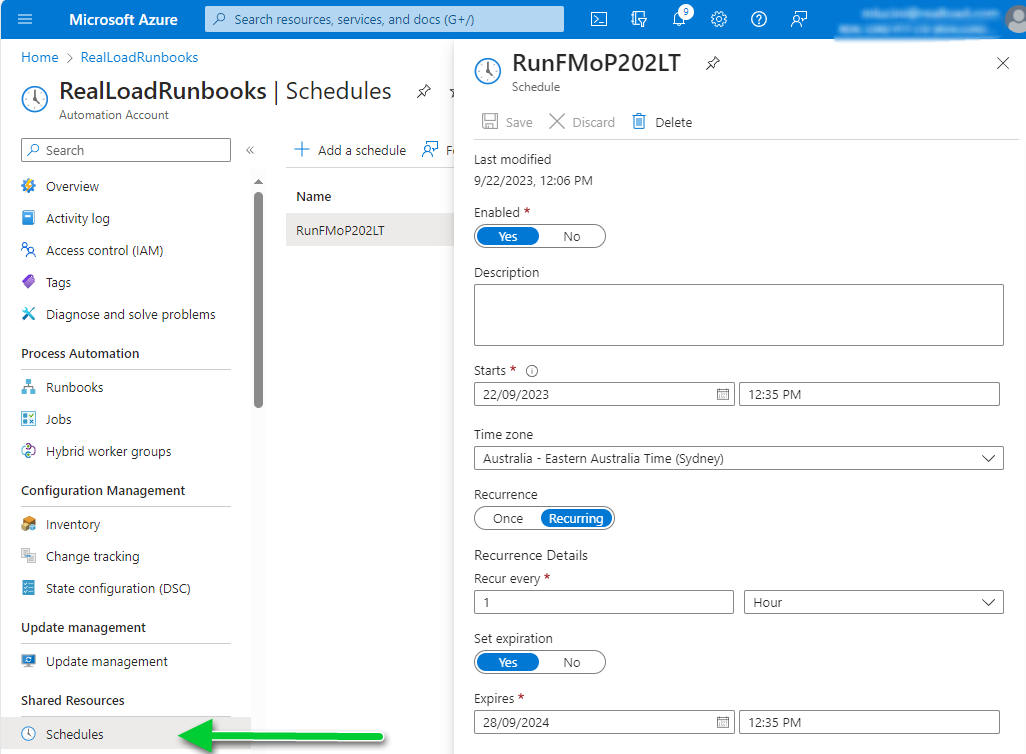
Create a schedule to fit your needs. In this example, it’s an hourly schedule with an expiration date set (optional).
The last step is to associate the schedule to the RunBook:
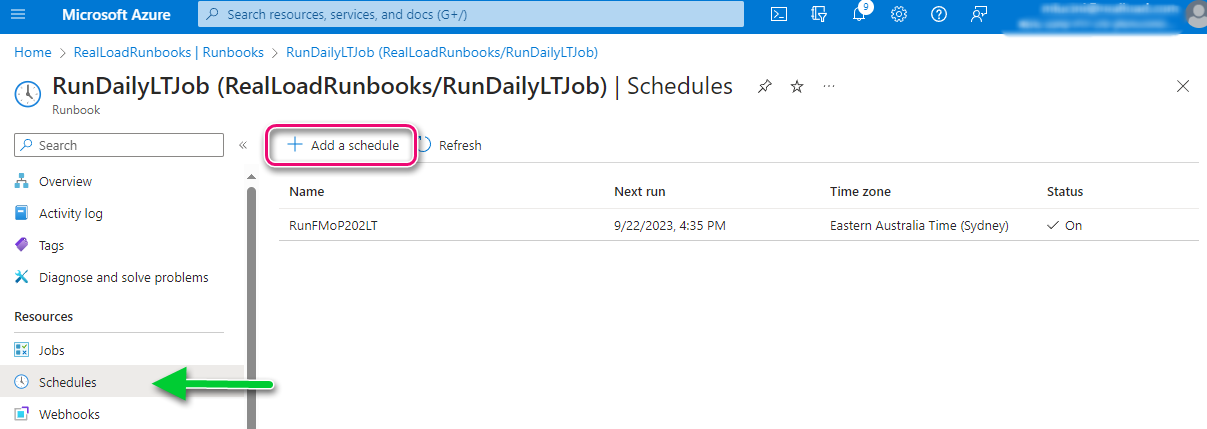
Done. From now on the selected perfomance test will be executed as per the configured schedule. You’ll be able to see the results of the executed Load Test in the Real Load portal.
The use case illustrated in this blog is a trivial use case. You can use similar code to integrate Real Load in your build pipelines of almost any CI/CD tool that you’re using.
A key feature that was added to the Real Load product recently is the support of JUnit tests. In a nutshell, it is possible to execute JUnit code as part of Synthetic Monitoring or even Performance Test scripts.
A while ago, I’ve implemented a simple DNS record testing script using an HTTP Web Test Plugin. Well, if I had to implement the same test today, I’d implement it using a JUnit test, as it looks more straightforward to me.
First you’ll need to prepare your JUnit test code. You’ll need to compile your JUnit tests in a .jar archive, so what I did I created in my preferred IDE (NetBeans) a new Maven project.
The dependencies I’ve used for the DNS tests are:
    <dependencies>
        <dependency>
            <groupId>junit</groupId>
            <artifactId>junit</artifactId>
            <version>4.12</version>
        </dependency>
        <dependency>
            <groupId>dnsjava</groupId>
            <artifactId>dnsjava</artifactId>
            <version>3.5.2</version>
        </dependency>
    </dependencies>
Below the code implementing the DNS lookups against 4 specific servers. As you can see, each JUnit test executes the lookup against a different server:
import java.net.UnknownHostException;
import static junit.framework.Assert.assertEquals;
import org.junit.Test;
import org.xbill.DNS.*;

public class DNSNameChecker {

    public DNSNameChecker() {
    }

    @Test
    public void testGoogle8_8_8_8() {

        String ARecord = CNAMELookup("8.8.8.8", "kb.realload.com");
        assertEquals("www.realload.com.", ARecord);
    }

    @Test
    public void testGoogle8_8_4_4() {

        String ARecord = CNAMELookup("8.8.4.4", "kb.realload.com");
        assertEquals("www.realload.com.", ARecord);
    }

    @Test
    public void testOpenDNS208_67_222_222() {

        String ARecord = CNAMELookup("208.67.222.222", "kb.realload.com");
        assertEquals("www.realload.com.", ARecord);
    }

    @Test
    public void testSOA_ns10_dnsmadeeasy_com() {

        String ARecord = CNAMELookup("ns10.dnsmadeeasy.com", "kb.realload.com");
        assertEquals("www.realload.com.", ARecord);
    }

    private String CNAMELookup(String DNSserver, String CNAME) {
        try {
            Resolver dnsResolver = null;
            dnsResolver = new SimpleResolver(DNSserver);
            Lookup l = new Lookup(Name.fromString(CNAME), Type.CNAME, DClass.IN);
            l.setResolver(dnsResolver);
            l.run();

            if (l.getResult() == Lookup.SUCCESSFUL) {
                // We'll only get back one A record, so we'll only return
                // the first record.
                return (l.getAnswers()[0].rdataToString());
            }

        } catch (UnknownHostException | TextParseException ex) {
            return null;
        }
        // Return null in all other cases, which means some sort of error
        // occurred while doing the lookup.
        return null;
    }

}
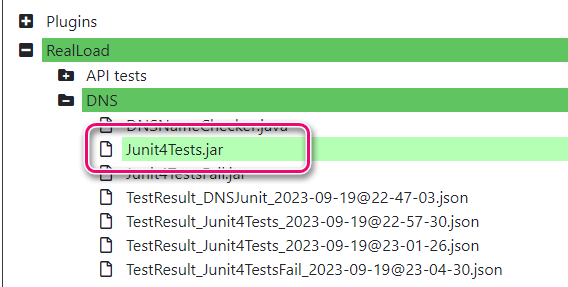
Test your code and then compile it into a .jar file.
The next step is to upload the .jar file containing the JUnit tests to the Real Load portal.
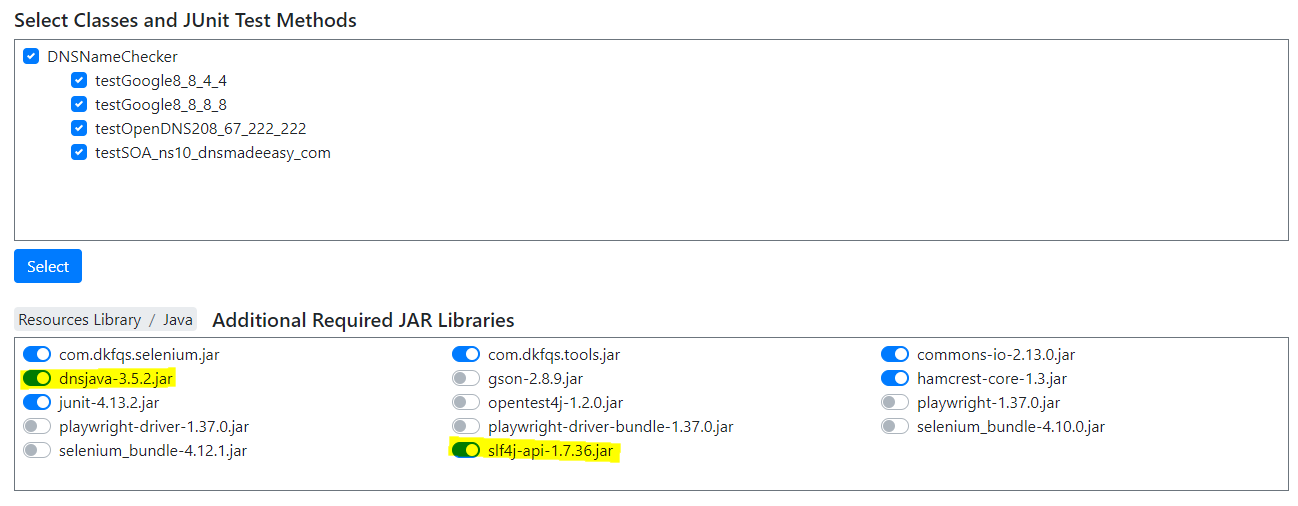
Now go to the Tests tab and define the new JUnit test:
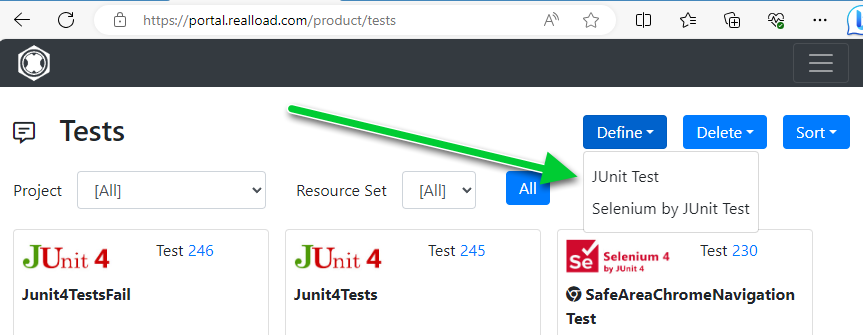
Select the .jar file containing the tests. You’ll then be presented with a page listing all tests found in the .jar file. Also make sure you select any dependencies required by your JUnit code, in this example the dnsjava and the slf4j jar files.
To verify that the test works, you might want to execute it once as a Performance Test (1 VU, 1 cycle).
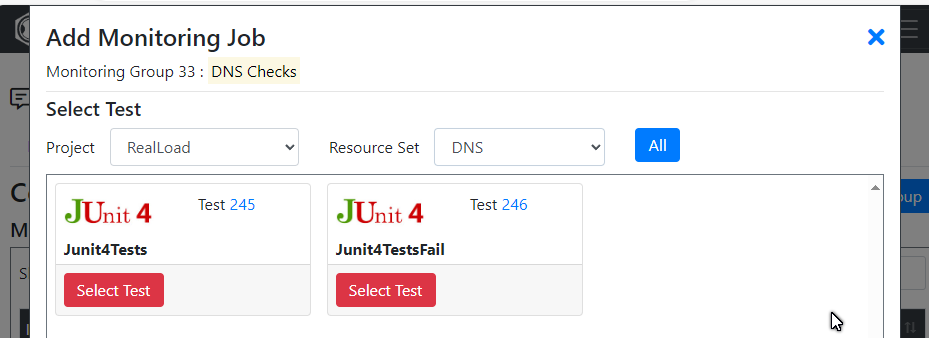
Now that the test is defined, add a Monitoring Job to execute a regular intervals your JUnit test. Assuming you already have a Monitoring Group defined, you’ll be able to add a JUnit test by selecting the test you’ve just configured:
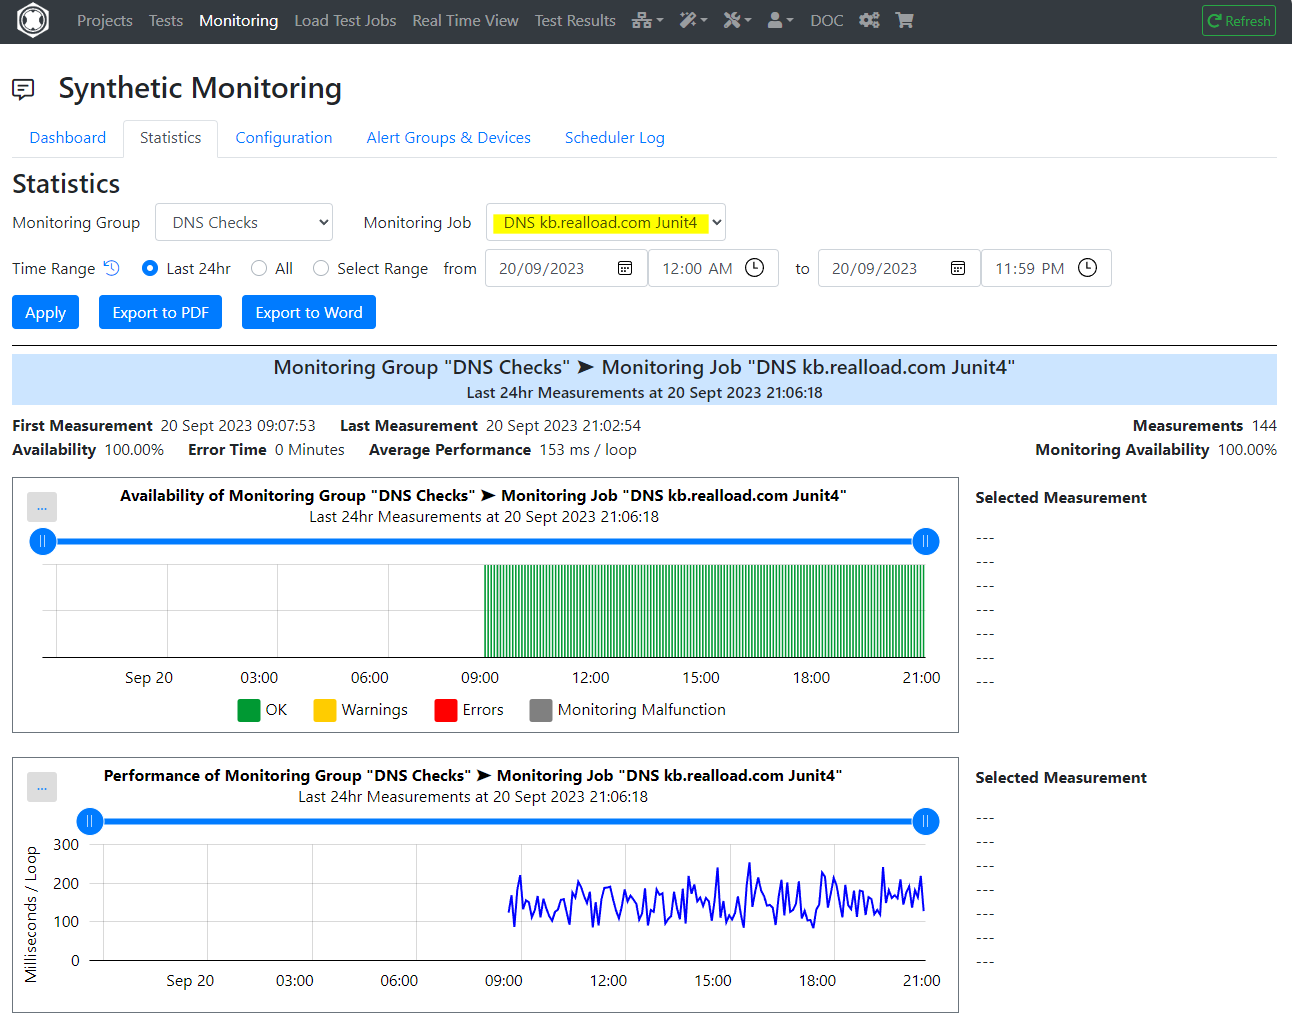
Done! Your JUnit tests will now execute as per configuration of your Monitoring Group, and you’ll be able to review historic data via the Real Load portal:
Say that you have an application that requires customers to authenticate using a Time based One Time Password (TOTP), generated by a mobile application. These OTPs are typically generated by implementing the algorithm described in RFC 6238.
Thanks to Real Load’s ability to implement plugins using the HTTP Test Wizard, it’s quite straightforward to generate OTPs in order to performance test your applications or to be used as part of synthetic monitoring.
So… from theory to practice. We had to implement such a plugin in order to performance test a third party product that requires users to submit a valid TOTP, if challenged. First, we’ve selected a Java TOTP implementation capable of generating OTPs as per the above RFC. There a are a few implementations out there, we decided to use Bastiaan Jansen’s implementation. A few lines of Java code only are required to generate the OTPs, and this implementation relies on one dependency only, so it was the perfect candidate.
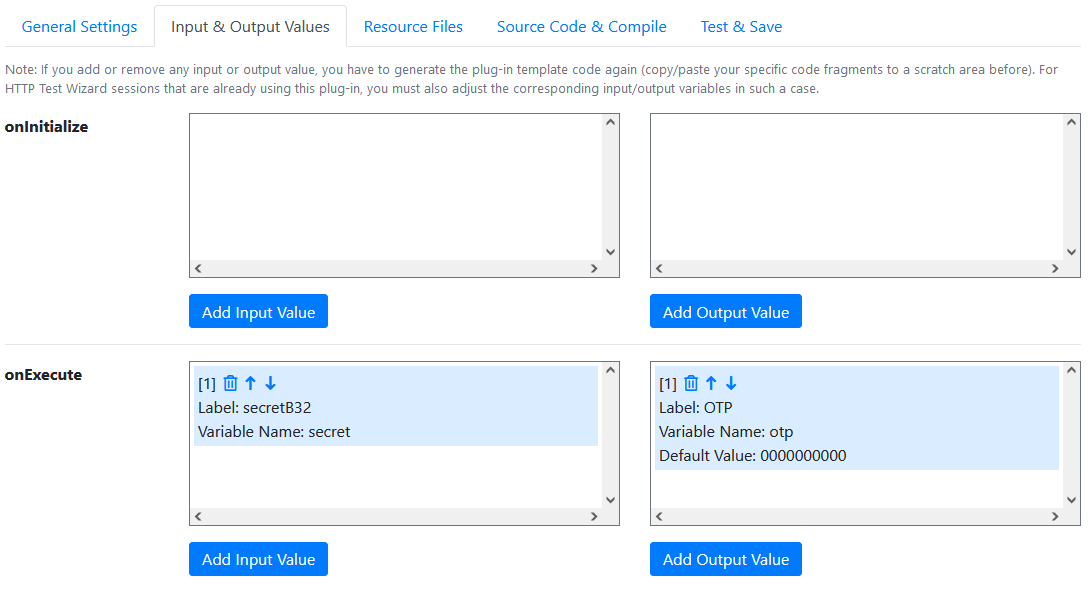
First thing to do is to define which input and output values the plugin requires. Things are quite straightforward in this case, as most of the TOTP related parameters are well known (like OTP interval, number of digits and HMAC algorithm), so we’ve hardcoded them in the plugin’s logic. The only variable is the secret (B32 encoded) that is required to generate the TOTP, which which is specific to each Virtual User.
The only output value is the generated One Time Password.
Using the PLugin Wizard, we configured the parameters as follows:
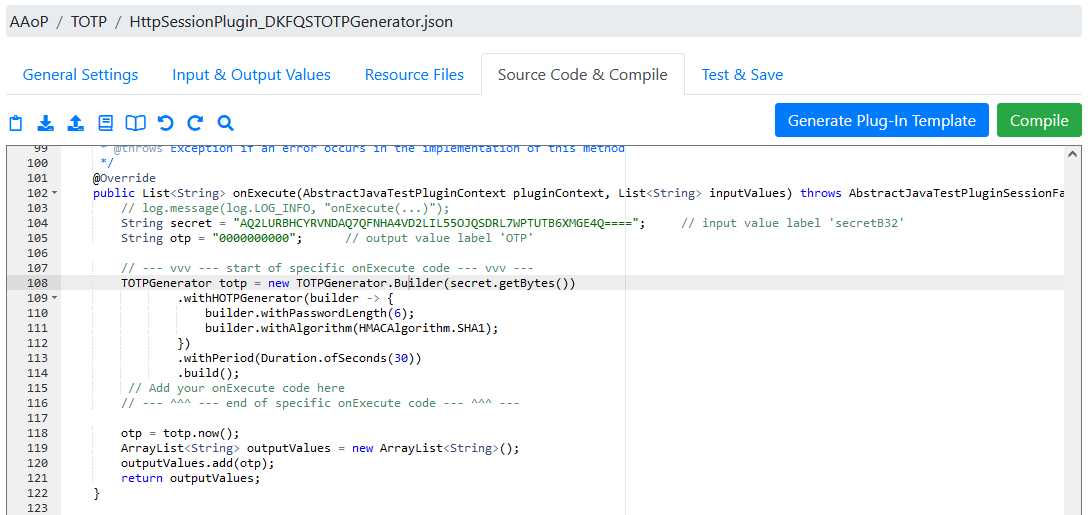
Next step is to implement the logic to generate the TOTP. In theory you can go key in your Java code in the Plugin Wizard shown in the screenshot below, but I’ve actually prepared the code in a separate IDE and then copy and pasted it back into online editor. Plz note that the Wizard will produce all scaffolding code, you just have to add the code shown between lines 108 and 115.
You’re now ready to test the plugin in the Wizard by going to the Test and Save tab. Provide the TOTP secret as base32 encoded string in the input parameter field:
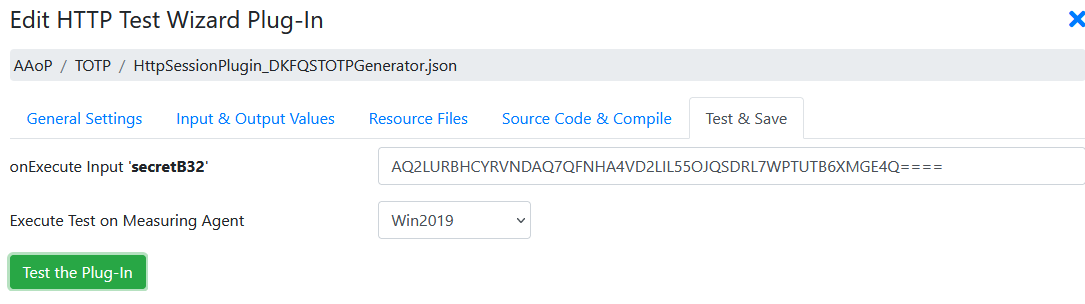
… then test that the returned value is correct. Compare the value to the value generated by an online generator, there are a few out there.
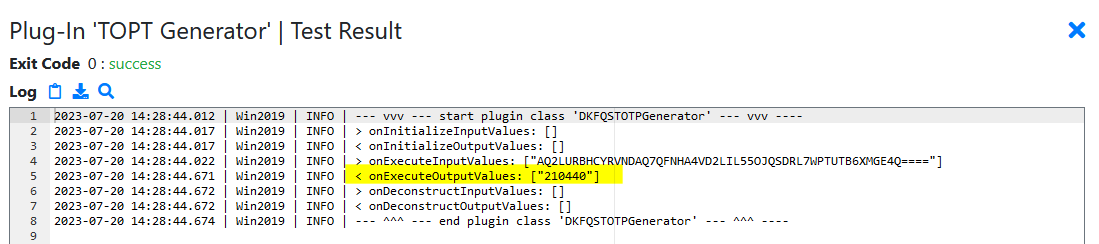
The last step is to add the plugin to your test script and invoke it at the right spot, like shown here:
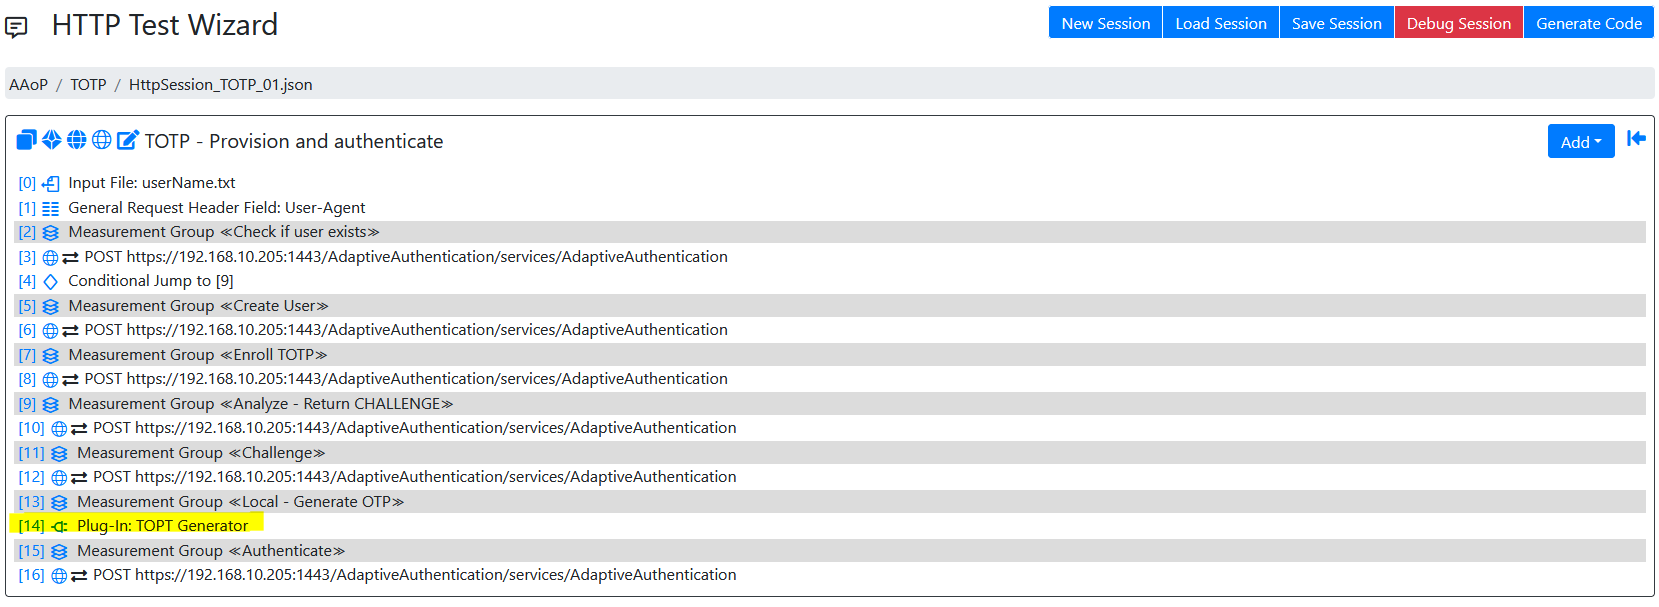
The plugin’s output value will be assigned to a variable, which in turn will be used in the next test step.
You can now use the script both for synthetic monitoring or performance testing on the Real Load platform , even for scenarios where a user has to provide a valid OTP.
If an application experiences high latency to the point of becoming unavailable or experiencing an outage, it can have severe consequences for businesses and their reputation.
In such cases, it is crucial to address the issue promptly and effectively.
Below are some steps that can be taken inorder to avoid the application high latency issues.
Load Testing and Capacity Planning: Conduct regular load testing to ensure that the application can handle anticipated user loads without significant latency issues. Use the insights gained from load testing to plan for future capacity needs and scale the infrastructure accordingly.
Monitoring and Alerting: Enhance your monitoring and alerting systems to detect and notify potential latency issues early on. Implement proactive monitoring for performance metrics, response times, and key indicators of the application’s health. Set up alerts to notify the appropriate teams when thresholds are breached.
For taking these above mentioned steps you need a cost effective tool to provide flawless Load Testing & Synthetic (Proactive) monitoring experience.
Welcome to Real Load: The next generation Load Testing & Synthetic Monitoring tool!
Real Load offers a Synthetic Monitoring and Load Testing solution that is flexible enough to cater for testing of a variety of applications such as:
The uniqueness of Real Load when compared to other tools is it’s All Purpose Interface, which enables customers to define scripts in any programming languages. The only requirement is a script or program must comply in order to be executed by the Real Load Platform.
This document explains:
The All Purpose Interface is the core of the product.
The architecture and the provided components that support this interface are referred as the Real Load Platform, which is optimized for performing load and stress tests with thousands of concurrent users.
This interface can be implemented by any programming language and regulates:
What requirements a script or program must comply in order to be executed by the Real Load Platform.
How the runtime behavior of the simulated users and the measured data of a script or program are reported to the Real Load Platform.
The great advantage of using the Real Load Platform is that only the basic functionality of a test has to be implemented. The powerful features of the Real Load Platform takes care of everything else, such as executing tests on remote systems and displaying the measured results in the form of diagrams, tables and statistics - in real time as well as final test result.
The product’s open architecture enables you to develop plug-ins, scripts and programs that measure anything that has numeric value - no matter which protocol is used!
The measured data are evaluated in real time and displayed as diagrams and lists. In addition to successfully measured values, also errors like timeouts or invalid response data can be collected and displayed in real time.
At least in theory, programs and scripts of any programming language can be executed, as long as such a program or script supports the All Purpose Interface.
In practice there are currently two options for integrating your own measurements into the Real Load Platform:
Write an HTTP Test Wizard Plug-In in Java that performs the measurement. This has the advantage that you only have to implement a subset of the “All Purpose Interface” yourself:
Such plug-ins can be developed quite quickly, as all other functions of the “All Purpose Interface” are already implemented by the HTTP Test Wizard.
Tip: An HTTP Test Wizard session can also only consist of plug-ins, i.e. you can “misuse” the HTTP Test Wizard to only carry out measurements that you have programmed yourself: Plug-In Example
Write a test program or from scratch. This can currently be programmed in Java or PowerShell (support for additional programming languages will be added in the future). This is more time-consuming, but has the advantage that you have more freedom in program development. In this case you have to implement all functions of the “All Purpose Interface”.
The All Purpose Interface must be implemented by all programs and scripts which are executed on the Real Load Platform. The interface is independent of any programming language and has only three requirements:
All of this seems a bit trivial, but has been chosen deliberately. So that the interface can support almost all programming languages.
Each executed program or script must support at least the following arguments:
Implementation Note: The test ends if either the Test Duration is elapsed or if Max Session Loops are reached for all simulated users. Currently executed sessions are not aborted.
In addition, the following arguments are optional, but also standardized:
| Argument | Java | PowerShell |
|---|---|---|
| Number of Users | -users number | -totalUsers number |
| Test Duration | -duration seconds | -inputTestDuration seconds |
| Ramp Up Time | -rampupTime seconds | -rampUpTime seconds |
| Max Session Loops | -maxLoops number | -inputMaxLoops number |
| Delay Per Session Loop | -delayPerLoop milliseconds | -inputDelayPerLoopMillis milliseconds |
| Data Output Directory | -dataOutputDir path | -dataOutDirectory path |
| Description | -description text | -description text |
| Debug Execution | -debugExec | -debugExecution |
| Debug Measuring | -debugData | -debugMeasuring |
For scripts which don’t support multiple threads the Real Load Platform starts for each simulated user a own operating system process per simulated user. On the other hand, for programs which support multiple threads, only one operating system process is started for all simulated users.
Scripts which are not able to run multiple threads must support the following additional generic command line argument:
| Argument | PowerShell |
|---|---|
| Executed User Number | -inputUserNo number |
Additional program and script specific arguments are supported by the Real Load Platform. Hoverer, their values are not validated by the platform.
During the execution of a test the Real Load Platform can create and delete at runtime additional control files in the Data Output Directory of a test job. The existence, and respectively the absence of such control files must be frequently checked by the running script or program, but not too often to avoid CPU and I/O overload. Rule of thumb: Multi-threaded programs should check the existence of such files every 5..10 seconds. Single-threaded scripts should check such files before executing a new session loop iteration.
The following control files are created or removed in the Data Output Directory by the Real Load Platform:
When a test job is started by the Real Load Platform on a Measuring Agent, then the Real Load Platform creates at first for each simulated user an empty data file in the Data Output Directory of the test job:
Data File: user_<Executed User Number>_statistics.out
Example: user_1_statistics.out, user_2_statistics.out, user_3_statistics.out, .. et cetera.
After that, the test script(s) or test program is started as operating system process. The test script or the test program has to write the current state of the simulated user and measured data to the corresponding Data File of the simulated user in JSON object format (append data to the file only – don’t create new files).
The Real Load Platform component Measuring Agent and the corresponding Data Collector are listening to these data files and interpret the measured data at real-time, line by line as JSON objects.

The following JSON Objects can be written to the Data Files:
| JSON Object | Description |
|---|---|
| Declare Statistic | Declare a new statistic |
| Register Execute Start | Registers the start of a user |
| Register Execute Suspend | Registers that the execution of a user is suspended |
| Register Execute Resume | Registers that the execution of a user is resumed |
| Register Execute End | Registers that a user has ended |
| Register Loop Start | Registers that a user has started a session loop iteration |
| Register Loop Passed | Registers that a session loop iteration of a user has passed |
| Register Loop Failed | Registers that a session loop iteration of a user has failed |
| Register Sample Start | Statistic-type sample-event-time-chart: Registers the start of measuring a sample |
| Add Sample Long | Statistic-type sample-event-time-chart: Registers that a sample has measured and report the value |
| Add Sample Error | Statistic-type sample-event-time-chart: Registers that the measuring of a sample has failed |
| Add Counter Long | Statistic-type cumulative-counter-long: Add a positive delta value to the counter |
| Add Average Delta And Current Value | Statistic-type average-and-current-value: Add delta values to the average and set the current value |
| Add Efficiency Ratio Delta | Statistic-type efficiency-ratio-percent: Add efficiency ratio delta values |
| Add Throughput Delta | Statistic-type throughput-time-chart: Add a delta value to a throughput |
| Add Test Result Annotation Exec Event | Add an annotation event to the test result |
Note that the data of each JSON object must be written as a single line which end with a \r\n line terminator.


Before the measurement of data begins, the corresponding statistics must be declared at runtime. Each declared statistic must have a unique ID. Multiple declarations with the same ID are crossed out by the platform.
Currently 5 types of statistics are supported:

It’s also supported to declare new statistics at any time during test execution, but the statistics must be declared first, before the measured data are added.
{
  "$schema": "http://json-schema.org/draft/2019-09/schema",
  "title": "DeclareStatistic",
  "type": "object",
  "required": ["subject", "statistic-id", "statistic-type", "statistic-title"],
  "properties": {
    "subject": {
      "type": "string",
      "description": "Always 'declare-statistic'"
    },
    "statistic-id": {
      "type": "integer",
      "description": "Unique statistic id"
    },
    "statistic-type": {
      "type": "string",
      "description": "'sample-event-time-chart' or 'cumulative-counter-long' or 'average-and-current-value' or 'efficiency-ratio-percent' or 'throughput-time-chart'"
    },
    "statistic-title": {
      "type": "string",
      "description": "Statistic title"
    },
    "statistic-subtitle": {
      "type": "string",
      "description": "Statistic subtitle | only supported by 'sample-event-time-chart'"
    },
    "y-axis-title": {
      "type": "string",
      "description": "Y-Axis title | only supported by 'sample-event-time-chart'. Example: 'Response Time'"
    },
    "unit-text": {
      "type": "string",
      "description": "Text of measured unit. Example: 'ms'"
    },
    "sort-position": {
      "type": "integer",
      "description": "The UI sort position"
    },
    "add-to-summary-statistic": {
      "type": "boolean",
      "description": "If true = add the number of measured and failed samples to the summary statistic | only supported by 'sample-event-time-chart'. Note: Synthetic measured data like Measurement Groups or Delay Times should not be added to the summary statistic"
    },
    "background-color": {
      "type": "string",
      "description": "The background color either as #hex-triplet or as bootstrap css class name, or an empty string = no special background color. Examples: '#cad9fa', 'table-info'"
    }
  }
}

Example:
{
  "subject":"declare-statistic",
  "statistic-id":1,
  "statistictype":"sample-event-time-chart",
  "statistic-title":"GET http://192.168.0.111/",
  "statistic-subtitle":"",
  "y-axis-title":"Response Time",
  "unit-text":"ms",
  "sort-position":1,
  "add-to-summarystatistic":true,
  "background-color":""
}
After the statistics are declared then the activities of the simulated users can be started. Each simulated user must report the following changes of the current user-state:
{
  "$schema": "http://json-schema.org/draft/2019-09/schema",
  "title": "RegisterExecuteStart",
  "type": "object",
  "required": ["subject", "timestamp"],
  "properties": {
    "subject": {
      "type": "string",
      "description": "Always 'register-execute-start'"
    },
    "timestamp": {
      "type": "integer",
      "description": "Unix-like time stamp"
    }
  }
}

Example:
{"subject":"register-execute-start","timestamp":1596219816129}
{
  "$schema": "http://json-schema.org/draft/2019-09/schema",
  "title": "RegisterExecuteSuspend",
  "type": "object",
  "required": ["subject", "timestamp"],
  "properties": {
    "subject": {
      "type": "string",
      "description": "Always 'register-execute-suspend'"
    },
    "timestamp": {
      "type": "integer",
      "description": "Unix-like time stamp"
    }
  }
}

Example:
{"subject":"register-execute-suspend","timestamp":1596219816129}
{
  "$schema": "http://json-schema.org/draft/2019-09/schema",
  "title": "RegisterExecuteResume",
  "type": "object",
  "required": ["subject", "timestamp"],
  "properties": {
    "subject": {
      "type": "string",
      "description": "Always 'register-execute-resume'"
    },
    "timestamp": {
      "type": "integer",
      "description": "Unix-like time stamp"
    }
  }
}

Example:
{"subject":"register-execute-resume","timestamp":1596219816129}
{
  "$schema": "http://json-schema.org/draft/2019-09/schema",
  "title": "RegisterExecuteEnd",
  "type": "object",
  "required": ["subject", "timestamp"],
  "properties": {
    "subject": {
      "type": "string",
      "description": "Always 'register-execute-end'"
    },
    "timestamp": {
      "type": "integer",
      "description": "Unix-like time stamp"
    }
  }
}

Example:
{"subject":"register-execute-end","timestamp":1596219816129}
Once a simulated user has started its activity it measures the data in so called ‘session loops’. Each simulated must report when a session loop iteration starts and ends:
{
  "$schema": "http://json-schema.org/draft/2019-09/schema",
  "title": "RegisterLoopStart",
  "type": "object",
  "required": ["subject", "timestamp"],
  "properties": {
    "subject": {
      "type": "string",
      "description": "Always 'register-loop-start'"
    },
    "timestamp": {
      "type": "integer",
      "description": "Unix-like time stamp"
    }
  }
}

Example:
{"subject":"register-loop-start","timestamp":1596219816129}
{
  "$schema": "http://json-schema.org/draft/2019-09/schema",
  "title": "RegisterLoopPassed",
  "type": "object",
  "required": ["subject", "loop-time", "timestamp"],
  "properties": {
    "subject": {
      "type": "string",
      "description": "Always 'register-loop-passed'"
    },
    "loop-time": {
      "type": "integer",
      "description": "The time it takes to execute the loop in milliseconds"
    },
    "timestamp": {
      "type": "integer",
      "description": "Unix-like time stamp"
    }
  }
}

Example:
{"subject":"register-loop-passed","loop-time":1451, "timestamp":1596219816129}
{
  "$schema": "http://json-schema.org/draft/2019-09/schema",
  "title": "RegisterLoopFailed",
  "type": "object",
  "required": ["subject", "timestamp"],
  "properties": {
    "subject": {
      "type": "string",
      "description": "Always 'register-loop-failed'"
    },
    "timestamp": {
      "type": "integer",
      "description": "Unix-like time stamp"
    }
  }
}

Example:
{"subject":"register-loop-failed","timestamp":1596219816129}
Within a session loop iteration the samples of the declared statistics are measured. For sample-event-time-chart statistics the simulated user must report when the measuring of a sample starts and ends:
{
  "$schema": "http://json-schema.org/draft/2019-09/schema",
  "title": "RegisterSampleStart",
  "type": "object",
  "required": ["subject", "statistic-id", "timestamp"],
  "properties": {
    "subject": {
      "type": "string",
      "description": "Always 'register-sample-start'"
    },
    "statistic-id": {
      "type": "integer",
      "description": "The unique statistic id"
    },
    "timestamp": {
      "type": "integer",
      "description": "Unix-like time stamp"
    }
  }
}

Example:
{"subject":"register-sample-start","statisticid":2,"timestamp":1596219816165}
{
  "$schema": "http://json-schema.org/draft/2019-09/schema",
  "title": "AddSampleLong",
  "type": "object",
  "required": ["subject", "statistic-id", "value", "timestamp"],
  "properties": {
    "subject": {
      "type": "string",
      "description": "Always 'add-sample-long'"
    },
    "statistic-id": {
      "type": "integer",
      "description": "The unique statistic id"
    },
    "value": {
      "type": "integer",
      "description": "The measured value"
    },
    "timestamp": {
      "type": "integer",
      "description": "Unix-like time stamp"
    }
  }
}

Example:
{"subject":"add-sample-long","statisticid":2,"value":105,"timestamp":1596219842468}
{
  "$schema": "http://json-schema.org/draft/2019-09/schema",
  "title": "AddSampleError",
  "type": "object",
  "required": ["subject", "statistic-id", "error-subject", "error-severity",
  "timestamp"],
  "properties": {
    "subject": {
      "type": "string",
      "description": "Always 'add-sample-error'"
    },
    "statistic-id": {
      "type": "integer",
      "description": "The unique statistic id"
    },
    "error-subject": {
      "type": "string",
      "description": "The subject or title of the error"
    },
    "error-severity": {
      "type": "string",
      "description": "'warning' or 'error' or 'fatal'"
    },
    "error-type": {
      "type": "string",
      "description": "The type of the error. Errors which contains the same error
    type can be grouped."
    },
    "error-log": {
      "type": "string",
      "description": "The error log. Multiple lines are supported by adding \r\n line terminators."
    },
    "error-context": {
      "type": "string",
      "description": " Context information about the condition under which the error occurred. Multiple lines are supported by adding \r\n line terminators."
    },
    "timestamp": {
      "type": "integer",
      "description": "Unix-like time stamp"
    }
  }
}

Example:
{
  "subject":"add-sample-error",
  "statistic-id":2,
  "error-subject":"Connection refused (Connection refused)",
  "error-severity":"error",
  "error-type":"java.net.ConnectException",
  "error-log":"2020-08-01 21:24:51.662 | main-HTTPClientProcessing[3] | INFO | GET http://192.168.0.111/\r\n2020-08-01 21:24:51.670 | main-HTTPClientProcessing[3] | ERROR | Failed to open or reuse connection to 192.168.0.111:80 |
 java.net.ConnectException: Connection refused (Connection refused)\r\n",
  "error-context":"HTTP Request Header\r\nhttp://192.168.0.111/\r\nGET / HTTP/1.1\r\nHost: 192.168.0.111\r\nConnection: keep-alive\r\nAccept: */*\r\nAccept-Encoding: gzip, deflate\r\n",
  "timestamp":1596309891672
}
Note about the error-severity :
Implementation note: After an error has occurred, the simulated user should wait at least 100 milliseconds before continuing his activities. This is to prevent that within a few seconds several thousand errors are measured and reported to the UI
For cumulative-counter-long statistics there is no such 2-step mechanism as for ‘sample-event-time-chart’ statistics. The value can simple increased by reporting a Add Counter Long object.
{
  "$schema": "http://json-schema.org/draft/2019-09/schema",
  "title": "AddCounterLong",
  "type": "object",
  "required": ["subject", "statistic-id", "value"],
  "properties": {
    "subject": {
      "type": "string",
      "description": "Always 'add-counter-long'"
    },
    "statistic-id": {
      "type": "integer",
      "description": "The unique statistic id"
    },
    "value": {
      "type": "integer",
      "description": "The value to increment"
    }
  }
}

Example:
{"subject":"add-counter-long","statistic-id":10,"value":2111}
To update a average-and-current-value statistic the delta (difference) values of the cumulated sum and the delta (difference) of the cumulated number of values has to be reported. The platform calculates then the average value by dividing the cumulated sum by the cumulated number of values. In addition, the last measured value must also be reported.
{
  "$schema": "http://json-schema.org/draft/2019-09/schema",
  "title": "AddAverageDeltaAndCurrentValue",
  "type": "object",
  "required": ["subject", "statistic-id", "sumValuesDelta", "numValuesDelta", "currentValue", "currentValueTimestamp"],
  "properties": {
    "subject": {
      "type": "string",
      "description": "Always 'add-average-delta-and-current-value'"
    },
    "statistic-id": {
      "type": "integer",
      "description": "The unique statistic id"
    },
    "sumValuesDelta": {
      "type": "integer",
      "description": "The sum of delta values to add to the average"
    },
    "numValuesDelta": {
      "type": "integer",
      "description": "The number of delta values to add to the average"
    },
    "currentValue": {
      "type": "integer",
      "description": "The current value, or -1 if no such data is available"
    },
    "currentValueTimestamp": {
      "type": "integer",
      "description": "The Unix-like timestamp of the current value, or -1 if no such data is available"
    }
  }
}

Example:
{
  "subject":"add-average-delta-and-current-value",
  "statistic-id":100005,
  "sumValuesDelta":6302,
  "numValuesDelta":22,
  "currentValue":272,
  "currentValueTimestamp":1634401774374
}
To update a efficiency-ratio-percent statistic, the delta (difference) of the number of efficient performed procedures and the delta (difference) of the number of inefficient performed procedures has to be reported.
{
  "$schema": "http://json-schema.org/draft/2019-09/schema",
  "title": "AddEfficiencyRatioDelta",
  "type": "object",
  "required": ["subject", "statistic-id", "efficiencyDeltaValue", "inefficiencyDeltaValue"],
  "properties": {
    "subject": {
      "type": "string",
      "description": "Always 'add-efficiency-ratio-delta'"
    },
    "statistic-id": {
      "type": "integer",
      "description": "The unique statistic id"
    },
    "efficiencyDeltaValue": {
      "type": "integer",
      "description": "The number of efficient performed procedures to add"
    },
    "inefficiencyDeltaValue": {
      "type": "integer",
      "description": "The number of inefficient performed procedures to add"
    }
  }
}

Example:
{
  "subject":"add-efficiency-ratio-delta",
  "statistic-id":100006,
  "efficiencyDeltaValue":6,
  "inefficiencyDeltaValue":22
}
To update a throughput-time-chart statistic, the delta (difference) value from a last absolute, cumulated value to the current cumulated value has to be reported, whereby the current time stamp is included in the calculation.
Although this type of statistic always has the unit throughput per second, a measured delta (difference) value can be reported at any time.
{
  "$schema": "http://json-schema.org/draft/2019-09/schema",
  "title": "AddThroughputDelta",
  "type": "object",
  "required": ["subject", "statistic-id", "delta-value", "timestamp"],
  "properties": {
    "subject": {
      "type": "string",
      "description": "Always 'add-throughput-delta'"
    },
    "statistic-id": {
      "type": "integer",
      "description": "The unique statistic id"
    },
    "delta-value": {
      "type": "number",
      "description": "the delta (difference) value"
    },
    "timestamp": {
      "type": "integer",
      "description": "The Unix-like timestamp of the delta (difference) value"
    }
  }
}

Example:
{
  "subject":"add-throughput-delta",
  "statistic-id":100003,
  "delta-value":0.53612,
  "timestamp":1634401774410
}
Add an annotation event to the test result.
{
  "$schema": "http://json-schema.org/draft/2019-09/schema",
  "title": "AddTestResultAnnotationExecEvent",
  "type": "object",
  "required": ["subject", "event-id", "event-text", "timestamp"],
  "properties": {
    "subject": {
      "type": "string",
      "description": "Always 'add-test-result-annotation-exec-event'"
    },
    "event-id": {
      "type": "integer",
      "description": "The event id, valid range: -1 .. -999999"
    },
    "event-text": {
      "type": "string",
      "description": "the event text"
    },
    "timestamp": {
      "type": "integer",
      "description": "The Unix-like timestamp of the event"
    }
  }
}

Example:
{
  "subject":"add-test-result-annotation-exec-event",
  "event-id":-1,
  "event-text":"Too many errors: Test job stopped by plug-in",
  "timestamp":1634401774410
}
Notes:
This plug-in “measures” a random value, and is executed in this example as the only part of an HTTP Test Wizard session.
The All Purpose Interface JSON objects are written using the corresponding methods of the com.dkfqs.tools.javatest.AbstractJavaTest class. This class is located in the JAR file com.dkfqs.tools.jar which is already predefined for all plug-ins.
import com.dkfqs.tools.javatest.AbstractJavaTest;
import com.dkfqs.tools.javatest.AbstractJavaTestPluginContext;
import com.dkfqs.tools.javatest.AbstractJavaTestPluginInterface;
import com.dkfqs.tools.javatest.AbstractJavaTestPluginSessionFailedException;
import com.dkfqs.tools.javatest.AbstractJavaTestPluginTestFailedException;
import com.dkfqs.tools.javatest.AbstractJavaTestPluginUserFailedException;
import com.dkfqs.tools.logging.LogAdapterInterface;
import java.util.ArrayList;
import java.util.List;
// add your imports here

/**
 * HTTP Test Wizard Plug-In 'All Purpose Interface Example'.
 * Plug-in Type: Normal Session Element Plug-In.
 * Created by 'DKF' at 24 Sep 2021 22:50:04
 * DKFQS 4.3.22
 */
@AbstractJavaTestPluginInterface.PluginResourceFiles(fileNames={"com.dkfqs.tools.jar"})
public class AllPurposeInterfaceExample implements AbstractJavaTestPluginInterface {
	private LogAdapterInterface log = null;

	private static final int STATISTIC_ID = 1000;
	private AbstractJavaTest javaTest = null;       // refrence to the generated test program

	/**
	 * Called by environment when the instance is created.
	 * @param log the log adapter
	 */
	@Override
	public void setLog(LogAdapterInterface log) {
		this.log = log;
	}

	/**
	 * On plug-in initialize. Called when the plug-in is initialized. <br>
	 * Depending on the initialization scope of the plug-in the following specific exceptions can be thrown:<ul>
	 * 	<li>Initialization scope <b>global:</b> AbstractJavaTestPluginTestFailedException</li>
	 * 	<li>Initialization scope <b>user:</b> AbstractJavaTestPluginTestFailedException, AbstractJavaTestPluginUserFailedException</li>
	 * 	<li>Initialization scope <b>session:</b> AbstractJavaTestPluginTestFailedException, AbstractJavaTestPluginUserFailedException, AbstractJavaTestPluginSessionFailedException</li>
	 * </ul>
	 * @param javaTest the reference to the executed test program, or null if no such information is available (in debugger environment)
	 * @param pluginContext the plug-in context
	 * @param inputValues the list of input values
	 * @return the list of output values
	 * @throws AbstractJavaTestPluginSessionFailedException if the plug-in signals that the 'user session' has to be aborted (abort current session - continue next session)
	 * @throws AbstractJavaTestPluginUserFailedException if the plug-in signals that the user has to be terminated
	 * @throws AbstractJavaTestPluginTestFailedException if the plug-in signals that the test has to be terminated
	 * @throws Exception if an error occurs in the implementation of this method
	 */
	@Override
	public List<String> onInitialize(AbstractJavaTest javaTest, AbstractJavaTestPluginContext pluginContext, List<String> inputValues) throws AbstractJavaTestPluginSessionFailedException, AbstractJavaTestPluginUserFailedException, AbstractJavaTestPluginTestFailedException, Exception {
		// log.message(log.LOG_INFO, "onInitialize(...)");

		// --- vvv --- start of specific onInitialize code --- vvv ---
		if (javaTest != null) {
		    this.javaTest = javaTest;

		    // declare the statistic
		    javaTest.declareStatistic(STATISTIC_ID,
            		                  AbstractJavaTest.STATISTIC_TYPE_SAMPLE_EVENT_TIME_CHART,
            		                  "My Measurement",
            		                  "",
            		                  "My Response Time",
            		                  "ms",
            		                  STATISTIC_ID,
            		                  true,
            		                  "");
		}
		// --- ^^^ --- end of specific onInitialize code --- ^^^ ---

		return new ArrayList<String>();		// no output values
	}

	/**
	 * On plug-in execute. Called when the plug-in is executed. <br>
	 * Depending on the execution scope of the plug-in the following specific exceptions can be thrown:<ul>
	 * 	<li>Initialization scope <b>global:</b> AbstractJavaTestPluginTestFailedException</li>
	 * 	<li>Initialization scope <b>user:</b> AbstractJavaTestPluginTestFailedException, AbstractJavaTestPluginUserFailedException</li>
	 * 	<li>Initialization scope <b>session:</b> AbstractJavaTestPluginTestFailedException, AbstractJavaTestPluginUserFailedException, AbstractJavaTestPluginSessionFailedException</li>
	 * </ul>
	 * @param pluginContext the plug-in context
	 * @param inputValues the list of input values
	 * @return the list of output values
	 * @throws AbstractJavaTestPluginSessionFailedException if the plug-in signals that the 'user session' has to be aborted (abort current session - continue next session)
	 * @throws AbstractJavaTestPluginUserFailedException if the plug-in signals that the user has to be terminated
	 * @throws AbstractJavaTestPluginTestFailedException if the plug-in signals that the test has to be terminated
	 * @throws Exception if an error occurs in the implementation of this method
	 */
	@Override
	public List<String> onExecute(AbstractJavaTestPluginContext pluginContext, List<String> inputValues) throws AbstractJavaTestPluginSessionFailedException, AbstractJavaTestPluginUserFailedException, AbstractJavaTestPluginTestFailedException, Exception {
		// log.message(log.LOG_INFO, "onExecute(...)");

		// --- vvv --- start of specific onExecute code --- vvv ---
		if (javaTest != null) {

		    // register the start of the sample
		    javaTest.registerSampleStart(STATISTIC_ID);

		    // measure the sample
		    final long min = 1L;
		    final long max = 20L;
		    long responseTime = Math.round(((Math.random() * (max - min)) + min));

		    // add the measured sample to the statistic
		    javaTest.addSampleLong(STATISTIC_ID, responseTime);

		    /*
		    // error case
		    javaTest.addSampleError(STATISTIC_ID,
                                    "My error subject",
                                    AbstractJavaTest.ERROR_SEVERITY_WARNING,
                                    "My error type",
                                    "My error response text or log",
                                    "");
            */
		}
		// --- ^^^ --- end of specific onExecute code --- ^^^ ---

		return new ArrayList<String>();		// no output values
	}

	/**
	 * On plug-in deconstruct. Called when the plug-in is deconstructed.
	 * @param pluginContext the plug-in context
	 * @param inputValues the list of input values
	 * @return the list of output values
	 * @throws Exception if an error occurs in the implementation of this method
	 */
	@Override
	public List<String> onDeconstruct(AbstractJavaTestPluginContext pluginContext, List<String> inputValues) throws Exception {
		// log.message(log.LOG_INFO, "onDeconstruct(...)");

		// --- vvv --- start of specific onDeconstruct code --- vvv ---
		// no code here
		// --- ^^^ --- end of specific onDeconstruct code --- ^^^ ---

		return new ArrayList<String>();		// no output values
	}

}


Recently we’ve launched a new version of our Real Load portal which adds the ability to periodically monitor your applications. The best thing to it is that you can re-use already developed load testing scripts to periodically monitor your applications. It makes sense to re-use the same underlying technology for both tasks, correct?
And, of course, nobody forces you to have the main followed by the dessert. You can also first have the dessert (… synthetic monitoring) followed by the main (… load testing). Or perhaps the dessert is the main for you, you can arrange the menu as it best suits your taste.
As for load testing, you’ll first have to prepare your testing script. Let’s assume you’ve already prepared it using our Wizards. Once the script is ready, the only remaining thing to do is to schedule it for periodic execution.
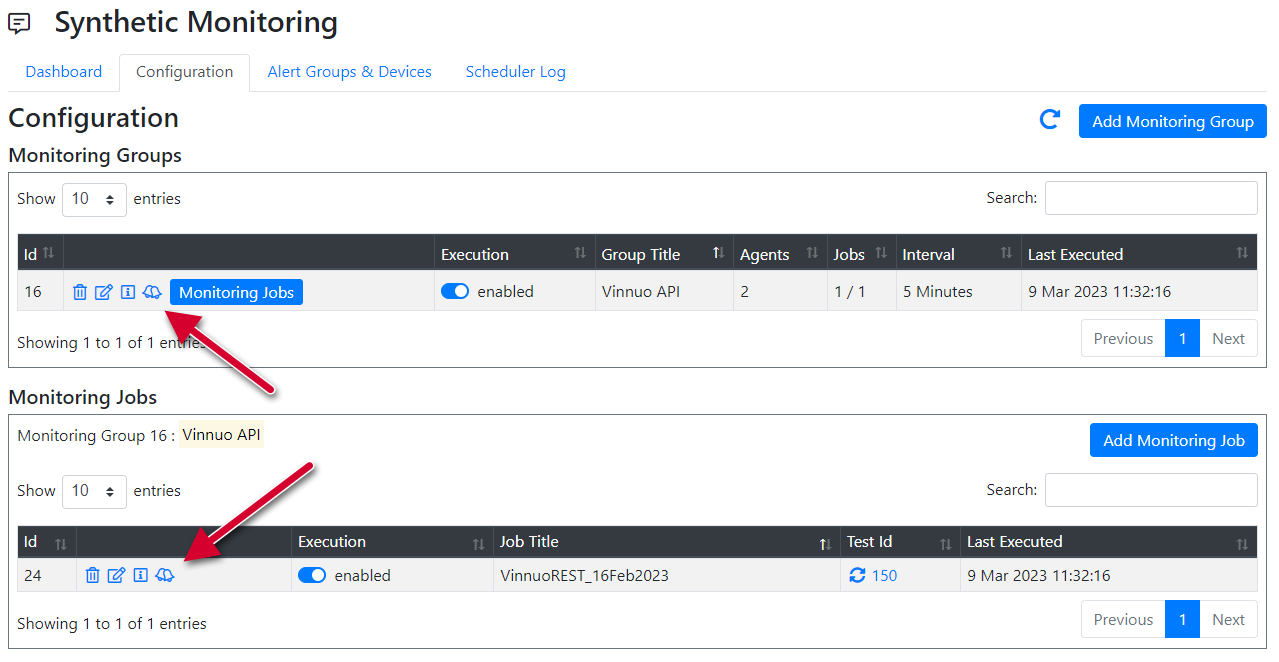
You can setup so called Monitoring Groups which will be made up of a number of Monitoring Jobs. Each monitoring job executes one of the prepared test scripts.
In this screenshot you’ll see one Monitoring Group called “Vinnuo APIs” (in the red box) which executes one test script, highlighted in the green box.
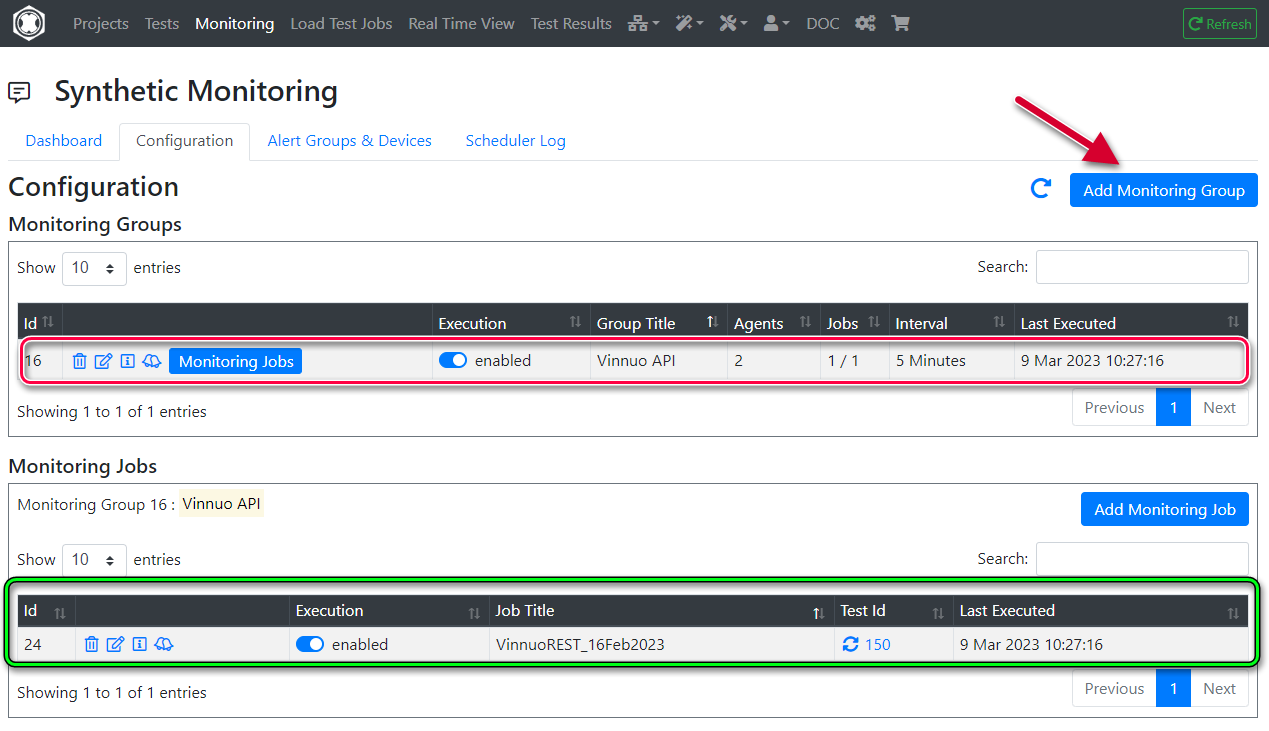
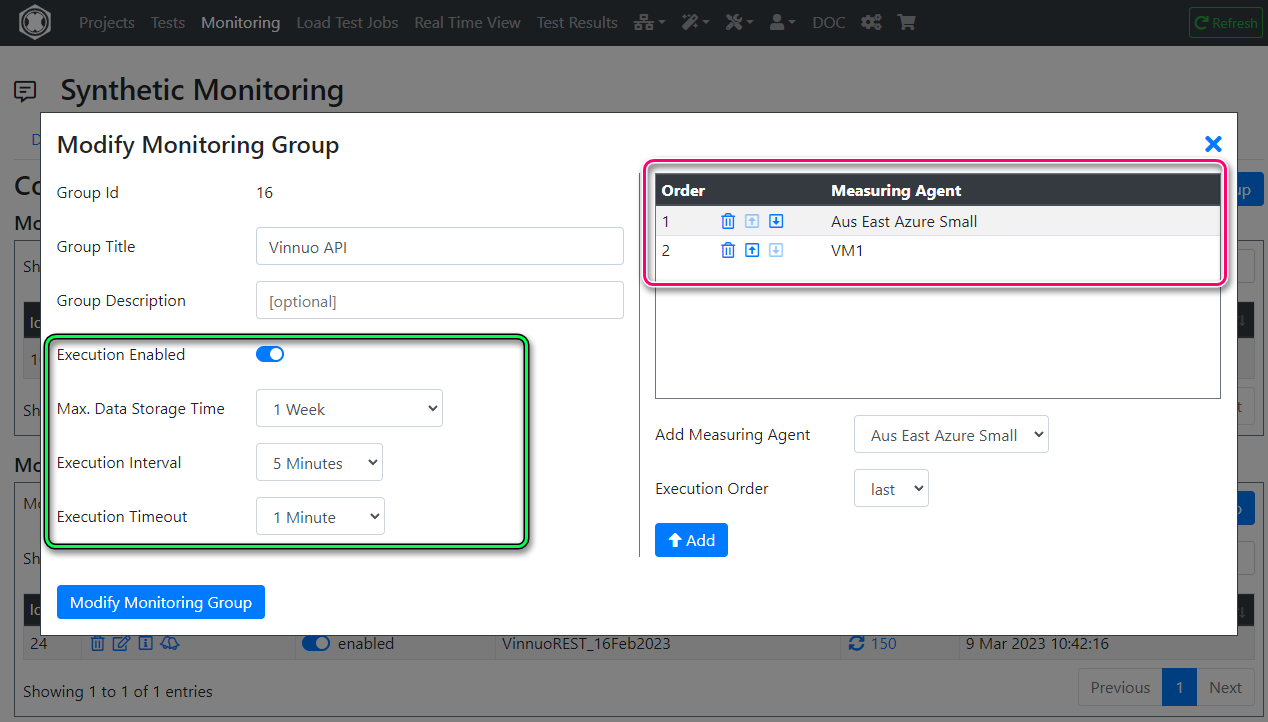
The key properties you can configure on a Monitoring Group are:
Last, you can enable/disable execution for the group by using the Execution Enabled toggle switch.
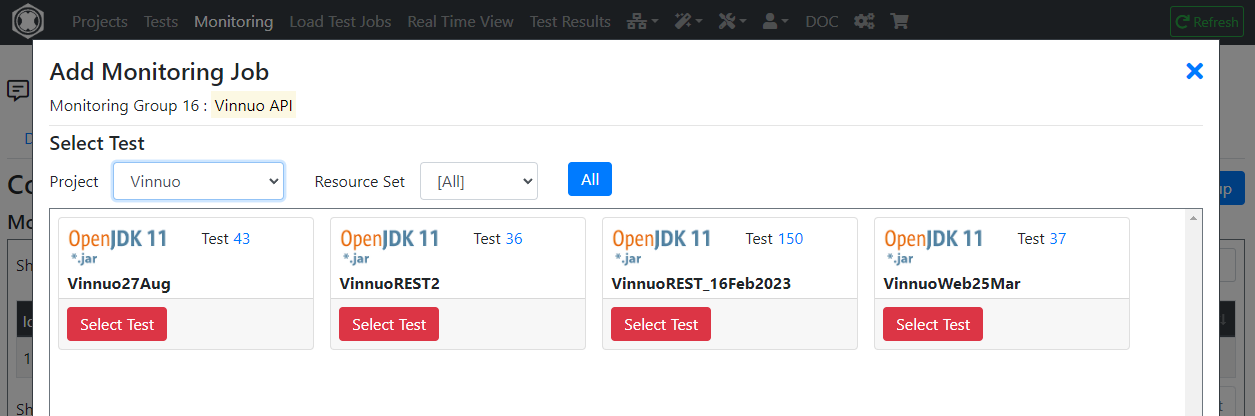
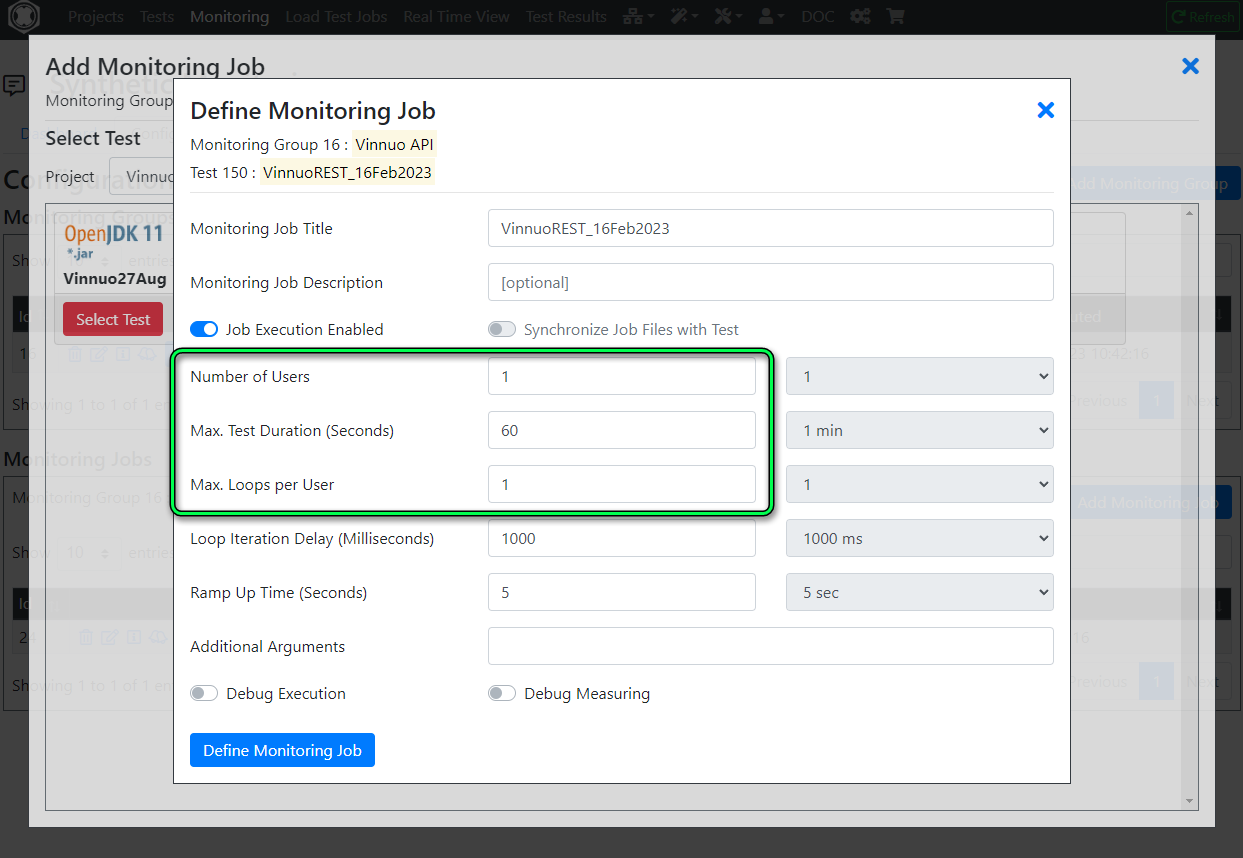
Next, you’ll add at least one Monitoring Job to the Monitoring test. Simply select from one of your projects a Test that was previously prepared.
In this example, I’ve picked one of the test that generates the relevant REST API call(s).
Next you’ll need to configured these key parameters relating to the execution of the test script. If you’re familiar with the load testing features of our product, these parameters will be familiar:
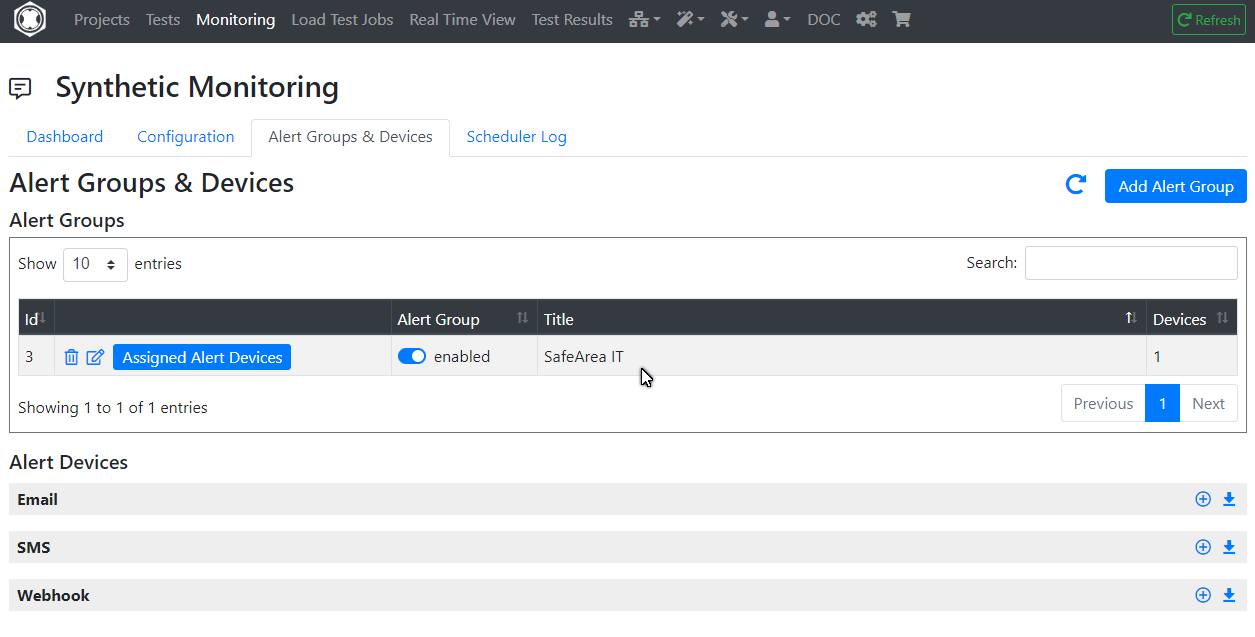
A synthetic monitoring solution wouldn’t be complete with an alerting functionality.
You can configure Alerting Groups to which you can assign a number of different device types to be alerted. Supported device types are:
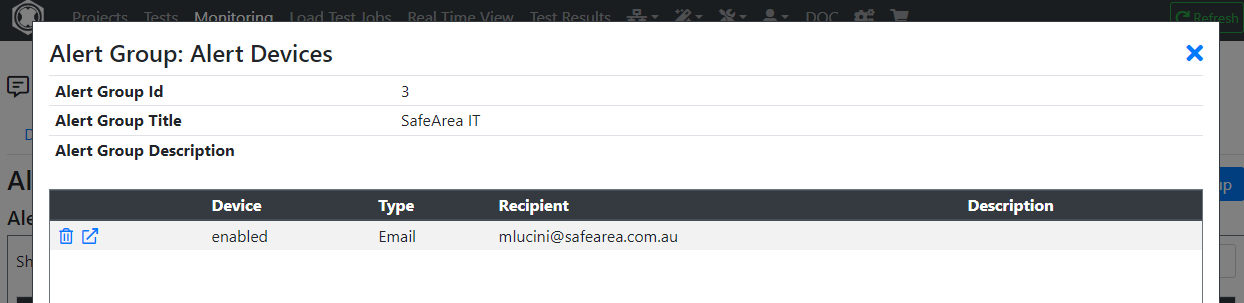
In this example, I’ve created an alerting group called “SafeArea IT”…
… to which I’ve assigned one email alerting device. Needless to say, you can assign the same alerting group to multiple
Now that the Alerting Groups are configured, you can configure alerting at the Monitoring Group or Monitoring Job level, whichever best suits your use case. Simply click on the alert icon and assign the Alerting Groups accordingly:
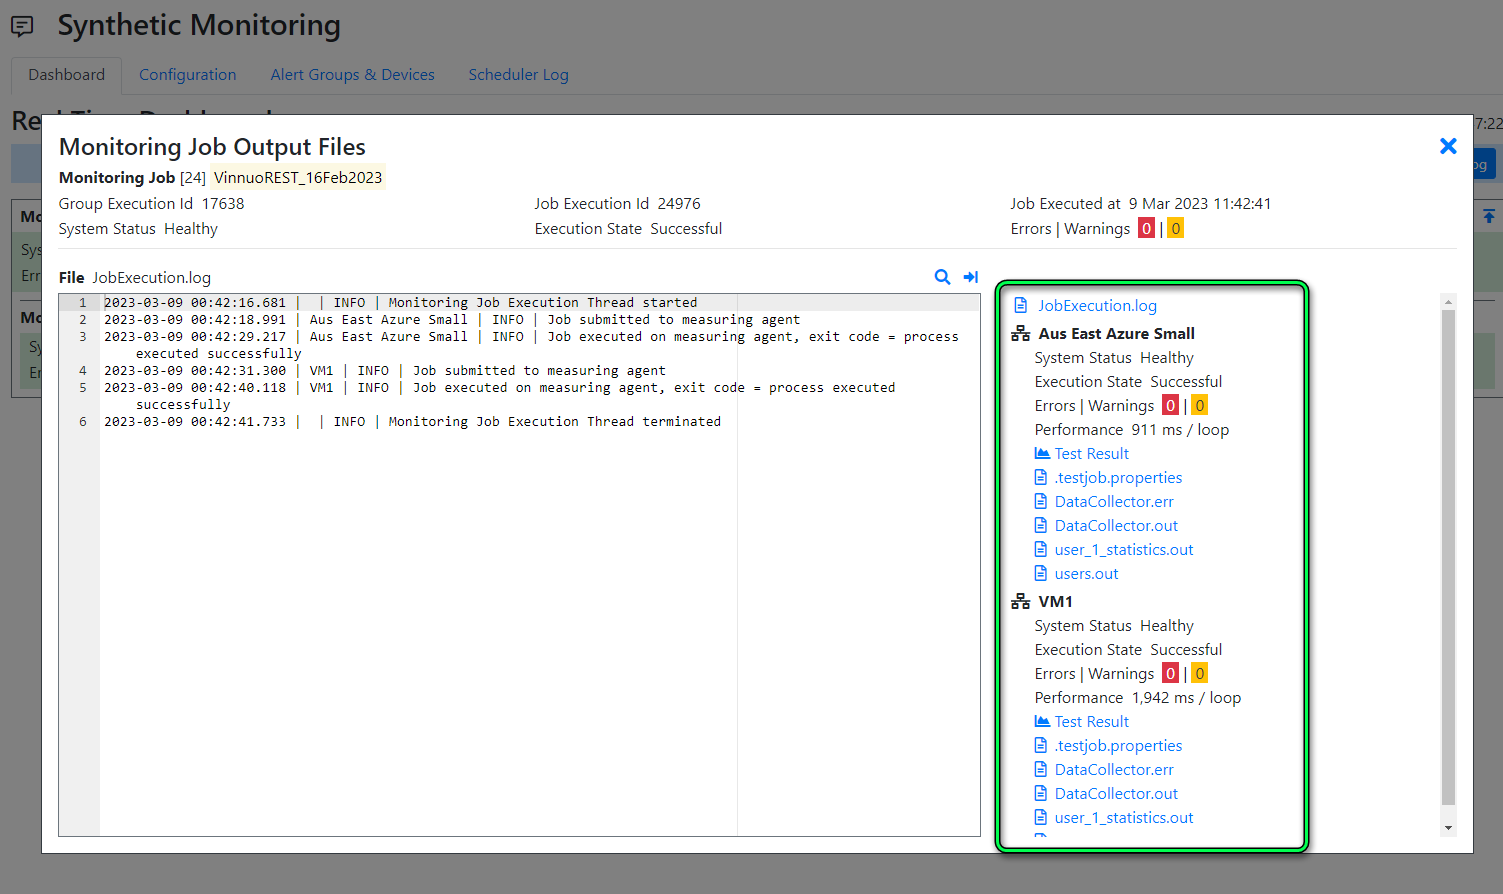
Once you’re done with the configuration, you’ll be able to monitor the health of your applications from the Real Time Dashboard. Please note that his dashboard is in evolution, and we’re adding new features on a regular basis.
For now, you’ll be able to:
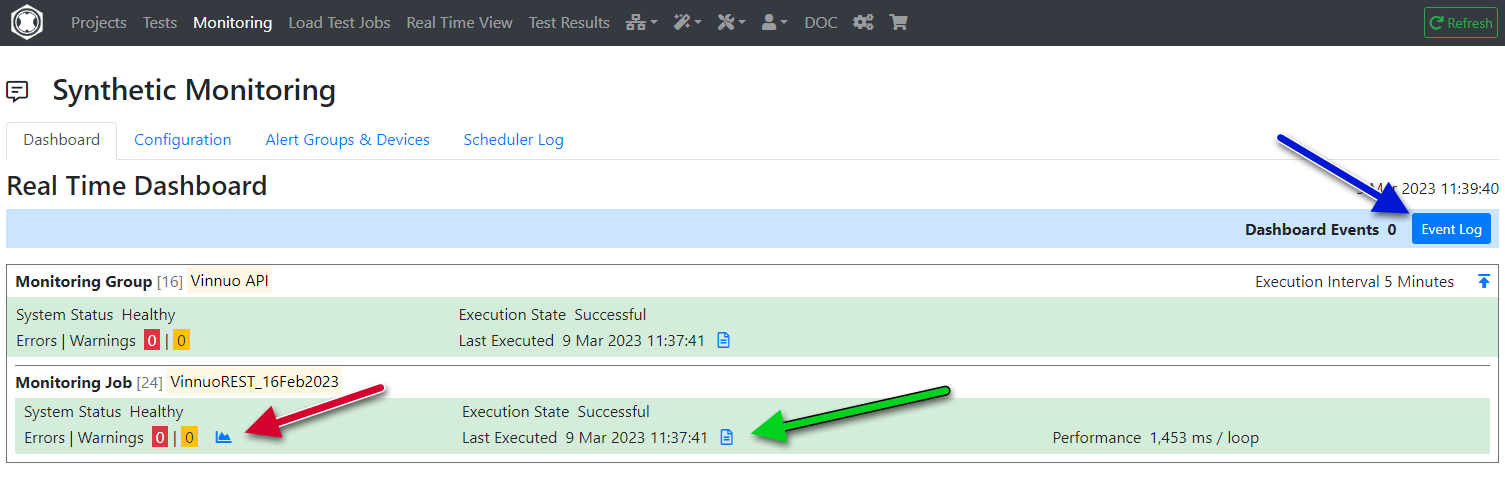
This screenshot shows the logs collected for the last job execution (green arrow). Note the additional logfiles (higlighted in the green box) that you can look at.
Regardless of whether your looking for a Synthetic Monitoring or Perfomance Testing solution, we can satisfy both needs.
Sign up for a free account on our portal portal.realload.com and click at “Sign up” (no Credit Card required). Then reach out to us at support@realload.com so that we can get you started with your first project.
Happy monitoring and load testing!
Do you need to record HTTP requests for your test script that require SSL Cert Client authentication? Tick, we support this use case now…
The Proxy Recorder has been enhanced to support recording against websites or applications that require presenting a valid SSL Client certificate.
From an high-level point of view this is how things work:

SSL Client certificates in the .pfx/.p12 format need to be uploaded to the Real Load Portal server.
The configuration of such SSL Client certificates in the Real Load Portal server is done by going to the Remote Proxy Recorders menu item and then clicking on the certificate symbol:
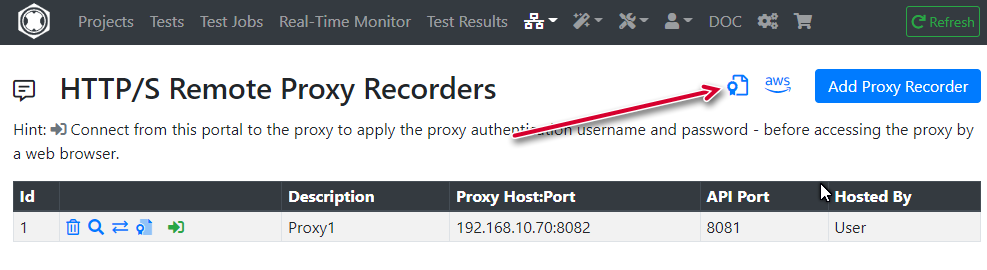
Then provide details about the certificate your uploading. Importantly the target server host must exactly match the hostname (or IP address) that will appear in HTTP requests.
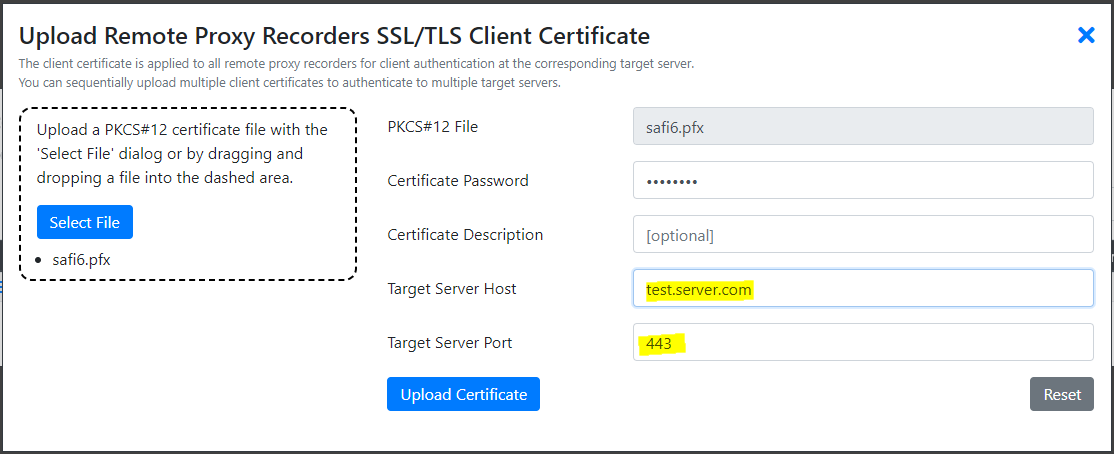
Done. Once uploaded, using the Proxy Recorder attempt to access a resource that requires SSL Client Cert authentication. You should be able to access the resource.
Most performance testing scenarios involve an application or an API presented over the HTTP or HTTPS protocol. The Real Load performance testing framework is capable of supporting essentially any type network application, as long as there is a way to generate valid client requests.
Real Load testing scripts are Java based applications that are executed by our platform. While our portal offers a wizard to easily create tests for the HTTP protocol, you can write write a performance test application for any network protocol by implementing such a Java based application.
This article illustrates how to prepare a simple load test application for a non-HTTP application. I’ve chosen to performance test our lab MS-SQL server. What I want to find out is how the SQL server performs if multiple threads attempt to update data stored in the same row. While the test sounds academic, this is a scenario I’ve seen leading to performance issues in real life applications…
Key requirements to implement such an application are:
Using your preferred Java development environment, create a project and add the following dependencies to it:
In NetBeans, the dependencies section would look as follows:

Once the dependencies are configured in your project, we’ll implemented the test logic (the AbstractJavaTest interface). For this application, we’ll create the below class.
Of particular relevance are these methods:
import com.dkfqs.tools.javatest.AbstractJavaTest;
import com.dkfqs.tools.javatest.AbstractJavaTestPeriodicThread;
import com.dkfqs.tools.javatest.AbstractJavaTestPeriodicThreadInterface;
import com.dkfqs.tools.logging.CombinedLogAdapter;
import com.zaxxer.hikari.HikariDataSource;
import com.zaxxer.hikari.pool.HikariPool;
import java.io.IOException;
import java.sql.Connection;
import java.sql.SQLException;
import java.sql.Statement;
import java.time.Instant;
import javax.sql.DataSource;

@AbstractJavaTest.ResourceFiles(fileNames = {})
public class MSSQLTest extends AbstractJavaTest implements AbstractJavaTestPeriodicThreadInterface {

    private static HikariPool pool;
    private static HikariDataSource dataSource = null;

    /**
     * Static Main: Create a new instance per simulated user and execute the
     * test.
     *
     * @param args the command line arguments
     */
    public static void main(String[] args) throws SQLException, NoSuchFieldException, IllegalArgumentException, IllegalAccessException {
        stdoutLog.message(LOG_INFO, "Max. Java Memory = " + (Runtime.getRuntime().maxMemory() / (1024 * 1024)) + " MB");

        dataSource = new HikariDataSource();
        dataSource.setDriverClassName("com.microsoft.sqlserver.jdbc.SQLServerDriver");
        dataSource.setJdbcUrl("jdbc:sqlserver://192.168.11.61:1433;databaseName=DEMO_DB;multiSubnetFailover=true;applicationName=RealLoad");
        dataSource.setUsername("sqluser");
        dataSource.setPassword("password");
        dataSource.setMinimumIdle(100);
        dataSource.setMaximumPoolSize(2000);
        dataSource.setAutoCommit(true);
        dataSource.setLoginTimeout(3);
        dataSource.setConnectionTimeout(3000);

        java.lang.reflect.Field field;
        field = dataSource.getClass().getDeclaredField("pool");
        field.setAccessible(true);
        pool = (HikariPool) field.get(dataSource);

        // log test specific resource files, annotated by @AbstractJavaTest.ResourceFiles at class level
        logTestSpecificResourceFileNames(MSSQLTest.class);
        try {
            // get all generic command line arguments
            abstractMain(args);

            // create a new instance per simulated user
            for (int x = 0; x < getArgNumberOfUsers(); x++) {
                new MSSQLTest(x + 1);
            }

            // start the test
            stdoutLog.message(LOG_INFO, "[Start of Test]");
            try {
                // start the user threads
                startUserThreads();

                // wait for the user threads end
                waitUserThreadsEnd();
            } catch (InterruptedException ie) {
                stdoutLog.message(LOG_WARN, "Test aborted by InterruptedException");
            }

            stdoutLog.message(LOG_INFO, "[End of Test]");
        } catch (Exception ex) {
            stdoutLog.message(LOG_FATAL, "[Unexpected End of Test]", ex);
        } finally {
            closeOutputFiles();
        }
    }

    /**
     * Close all output files.
     */
    private static void closeOutputFiles() {
    }

    // - - - vvv - - - instance  - - - vvv - - -
    private CombinedLogAdapter log = new CombinedLogAdapter();

    /**
     * Constructor: Create a new instance per simulated user.
     *
     * @param userNumber the simulated user number
     * @throws IOException if the user statistics out file cannot be created
     */
    public MSSQLTest(int userNumber) throws IOException {
        super(userNumber);
        addSimulatedUser(this);
    }

    @Override
    public void declareStatistics() {
        declareStatistic(0, STATISTIC_TYPE_SAMPLE_EVENT_TIME_CHART, "Get connection from pool", "", "Execution Time", "ms", 0, true, "");
        declareStatistic(1, STATISTIC_TYPE_SAMPLE_EVENT_TIME_CHART, "Exec SQL Update stmnt ", "", "Execution Time", "ms", 1, true, "");
    }

    @Override
    public void executeUserStart(int userNumber) throws Exception {
        // start a periodic thread that reports summary measurement results measured across all simulated users
        if (userNumber == 1) {
            AbstractJavaTestPeriodicThread periodicThread = new AbstractJavaTestPeriodicThread(this, 1000L, this);
            periodicThread.setName("periodic-thread");
            periodicThread.setDaemon(true);
            periodicThread.start();
        }

    }

    @Override
    public int executeUserSession(int userNumber, int sessionLoopNumber) throws Exception {
        long measurementGroupStartTime$0 = System.currentTimeMillis();
        registerSampleStart(0);

        // 1- Get a connection from pool
        Connection connection = null;
        try {
            connection = dataSource.getConnection();
        } catch (Exception e) {
            log.message(LOG_ERROR, e.getMessage());
            return SESSION_STATUS_FAILED;
        }
        addSampleLong(0, System.currentTimeMillis() - measurementGroupStartTime$0);

        // 2 - Prepare SQL statement
        Statement st = connection.createStatement();
        String SQL = "update TEST_TABLE set VALUE_NUM = '7058195060625506304' where DATA_URI = '2566' AND DATA_URI = '0' AND DATA_ID = '-1'";

        // 3 - Execute statement
        registerSampleStart(1);
        long measurementGroupStartTime$1 = System.currentTimeMillis();
        st.executeUpdate(SQL);
        addSampleLong(1, System.currentTimeMillis() - measurementGroupStartTime$1);
        st.close();
        connection.close();

        // end of passed session
        return SESSION_STATUS_SUCCESS;
    }

    @Override
    public void executeUserSessionEnd(int sessionStatus, int userNumber, int sessionLoopNumber) throws Exception {
    }

    /**
     * Called periodically by an independent thread with the context of the
     * first simulated user. Reports summary measurement results which were
     * measured over all simulated users.
     *
     * @param abstractJavaTest the context of the first simulated user
     * @throws Exception if an error occurs - logged to stdout
     */
    @Override
    public void onPeriodicInterval(AbstractJavaTest abstractJavaTest) throws Exception {
      }

    @Override
    public void onUserSuspend(int userNumber) throws Exception {
    }

    @Override
    public void onUserResume(int userNumber) throws Exception {
    }

    @Override
    public void executeUserEnd(int userNumber) throws Exception {

    }

    @Override
    public void onUserTestAbort(int userNumber) throws Exception {

    }

}
Once you’ve compiled your application and generated a jar file (… make sure the main class is mentioned in the META-INF/MANIFEST.MF file) you’re ready to configure the load test in the Real Load portal.
After logging into the portal, create a new project (… “MSSQL” in the below screenshot) and a new Resource Set (“Test 1”). Upload your performance test application jar file (“RealLoadTest3.jar” in this example) and all other dependencies.
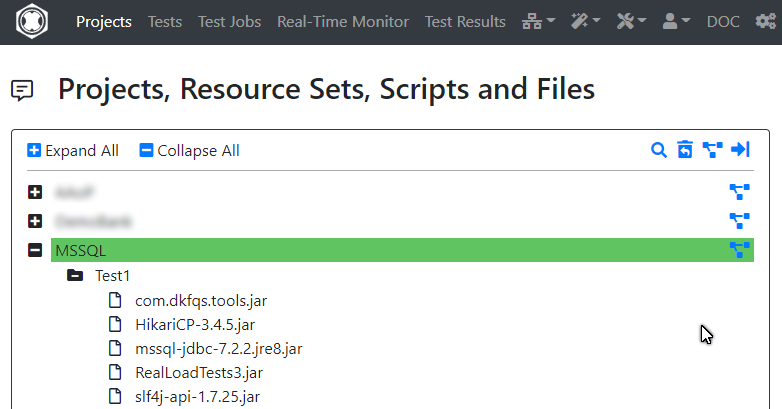
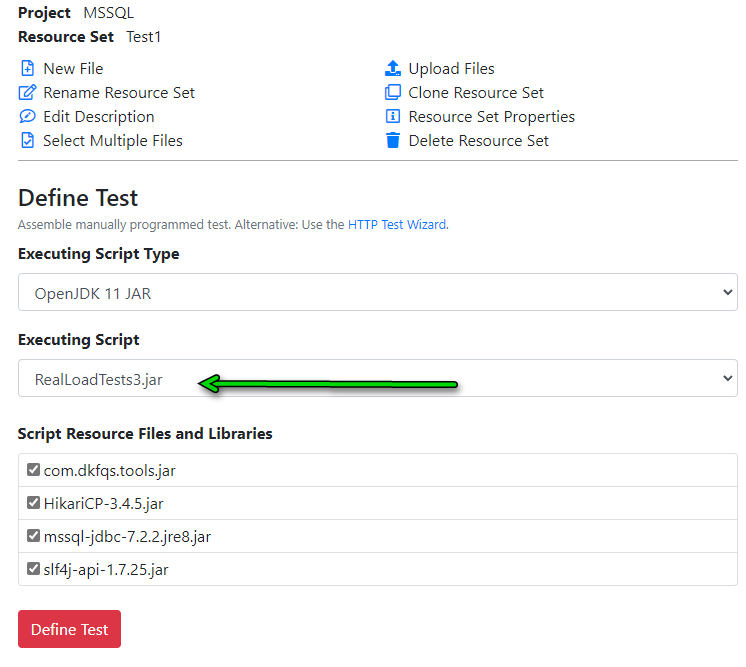
Once everything is uploaded, define a new test by clicking on the Resource Set (“Test 1”). Make sure you select the .jar file you’ve developed as the “Executing Script” and tick all the required dependencies in the Resource list.
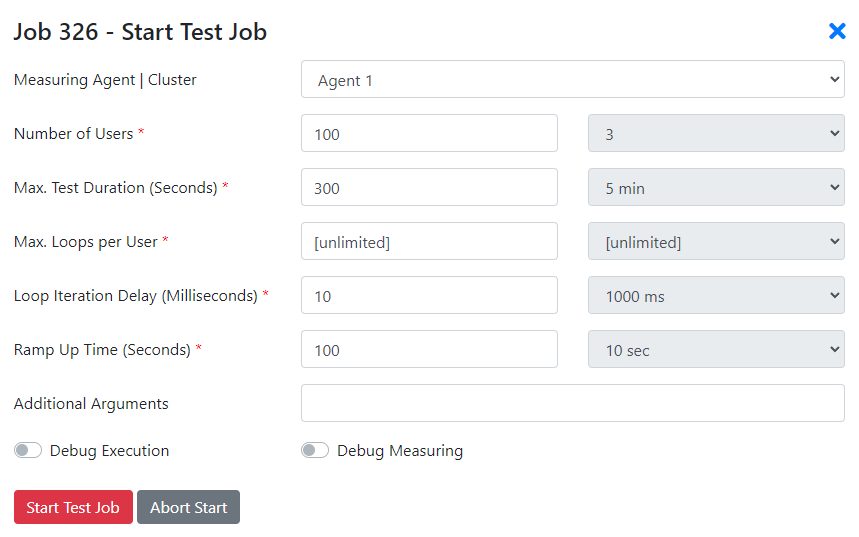
You’re now ready to execute your performance test. When starting the test job select how many threads (Users) should execute you test application, ramp up time and test execution duration.
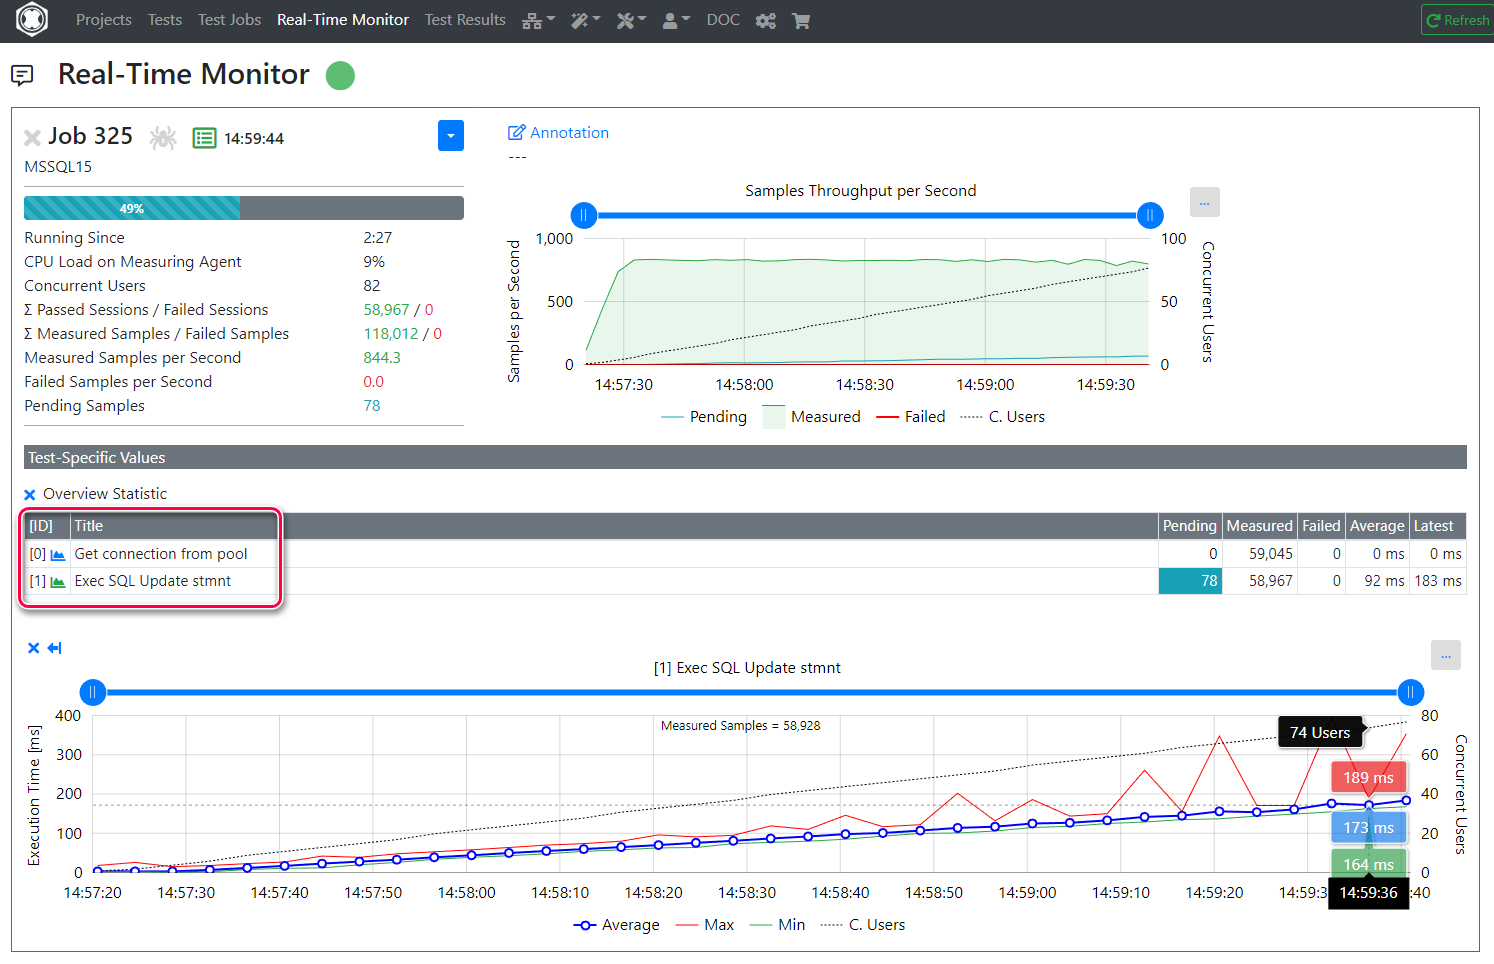
While the performance test is executing, you’ll notice that the metrics you’ve declared in the Java source code appear in the real time monitoring window:
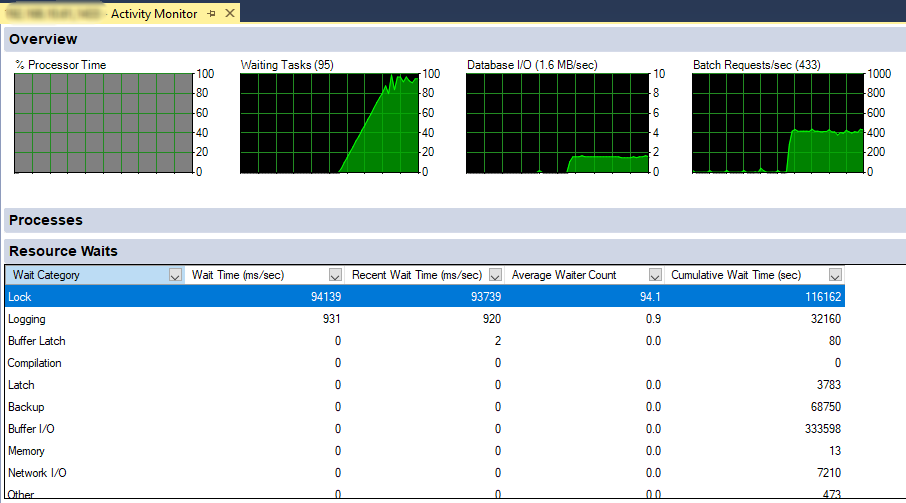
If you keep an eye on MS-SQL Management Studio, in the activity monitor you’ll notice that resource locking is the wait class with the highest wait times. Not so surprisingly I might add, given the nature of the test.
Also note that the waiting task number is very close to the number of virtual users (concurrent threads) simulated, approx. 100.
Once the test completed, you can review collected metrics. The graph at the bottom of this screenshot shows execution times throughout the test of the SQL update statement, as load ramped up.
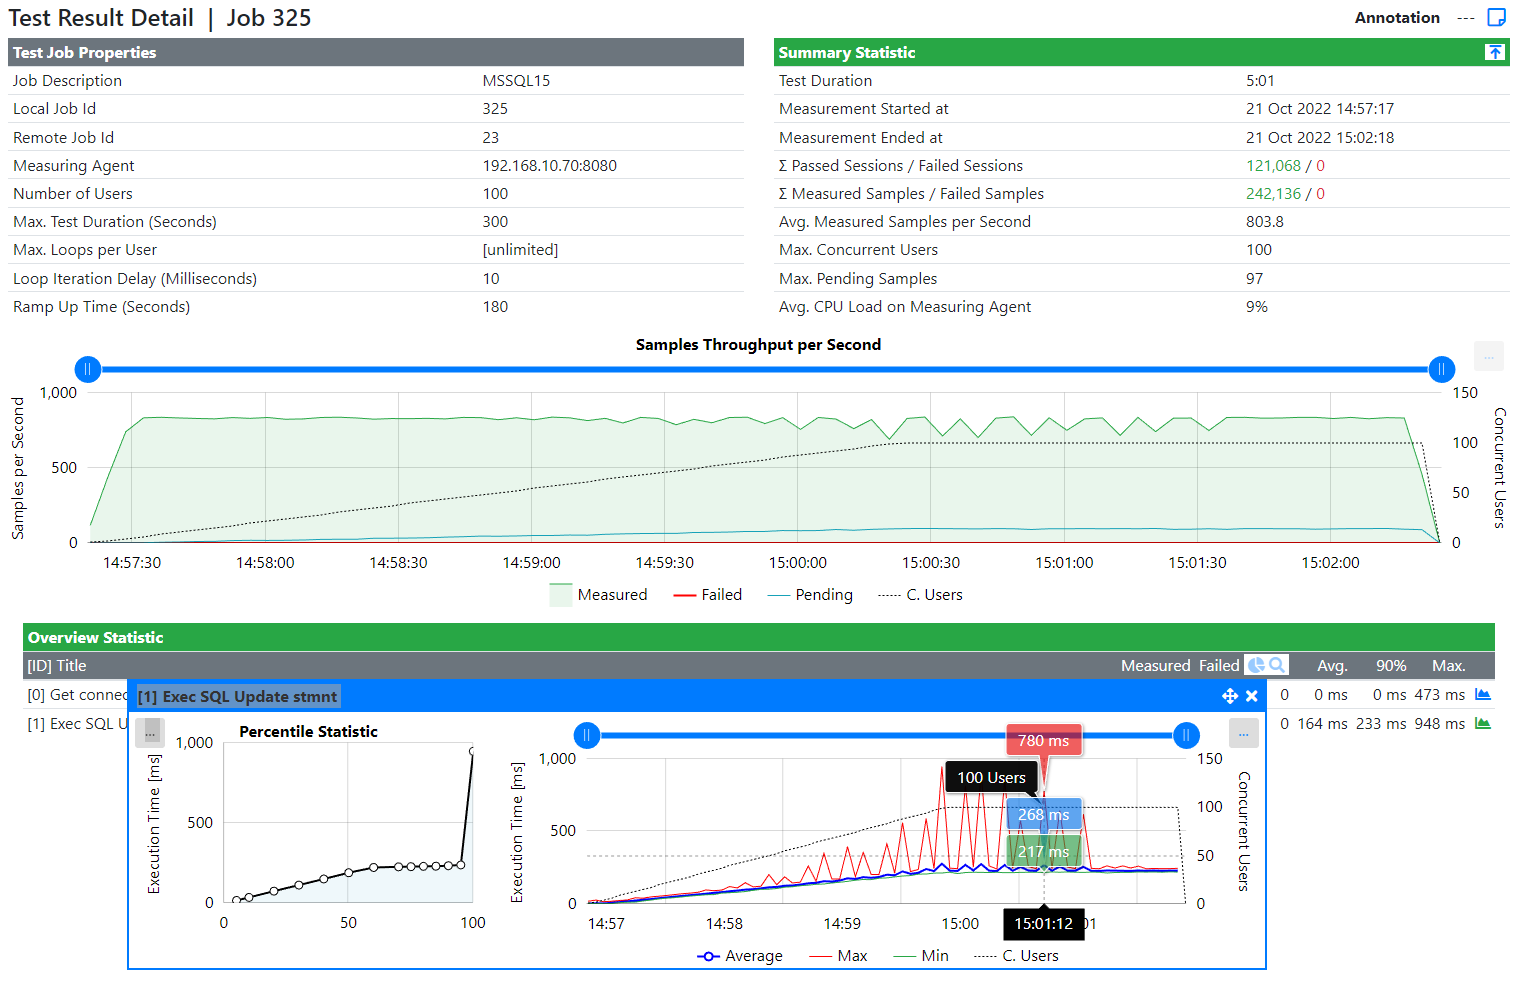
As you can see, it’s quite straightforward to prepare an application to performance test almost any network protocol.
Should you have a requirement to performance test an exotic protocol and your current tool doesn’t allow you to do so, do not hesitate to contact us. Perhaps we can help…
Thank you for reading and do not hesitate to reach out should you have any Qs.
An exciting new feature was added in Real Load v4.7.3. The URL Explorer feature allows you to quickly handle session specific random values that might appear in your load test script requests and responses.
In a nutshell, this is how things work:
All of this is documented in this short video (7 minutes) which walks you through the above process.
As always, feedback or questions are welcome using our contact form.
While running a load test against an API product that I have to deal with in my other day to day job, I’ve noticed something in both the results and at the OS level (… on the DB server) that didn’t make much sense.
The results of the performance test where somewhat OK but kinda unstable (… some strange variances in the response times). This graph tells the story better than 1000s of words.
Note the green line (transactions per second) going all over the place:
At first I suspected some sort of issue with the application server (Weblogic) and the DB Connection Pool. But all looked good there…
Then I’ve cast an eye on Oracle Enterprise Manager and noticed that most of the DB waits were related to I/O, although the storage of this particular test DB is located on a reasonably fast NVME SSD.
So I started looking at I/O stats on the Oracle Linux server hosting this DB. Being a lab DB, it’s more or less a standard Oracle install with not much performance tuning applied. Nor am I an Oracle expert that knows all secrets of the trade…
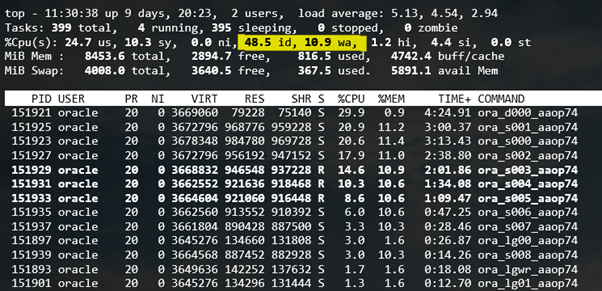
Anyways, there was one thing that somehow didn’t stack up: At the OS level, the % spent by the CPU in iowait was sporadically incredibly high (… 70%+ or so) with the CPU idle time plunging to less than 10%:
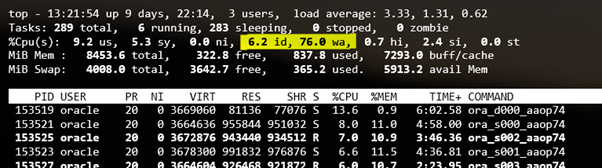
After reading various online articles about this, most of which suggested beefier HW or rewrite the app the app so that it would be more efficient with commits, it dawned on my that perhaps Oracle wasn’t using async I/O when writing to disk causing these high waitio stats.
I finally bumped into a few articles talking about async I/O settings in Oracle and found a few useful SQL queries…
This one will assist in figuring out whether async I/O is enabled on your Oracle DB files:
COL NAME FORMAT A50
SELECT NAME,ASYNCH_IO FROM V$DATAFILE F,V$IOSTAT_FILE I
WHERE  F.FILE#=I.FILE_NO
AND    FILETYPE_NAME='Data File';
… leading to a result like this. Note that for all files async IO is disabled…
So I decided to enable async I/O with these few SQL commands:
ALTER SYSTEM SET FILESYSTEMIO_OPTIONS=SETALL SCOPE=SPFILE;
SHUTDOWN IMMEDIATE;
STARTUP;
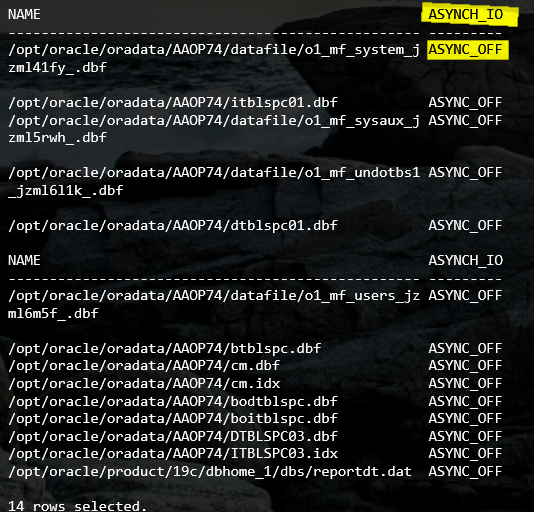
… and then checking again. As you can see, async I/O is enabled now:
NAME                                               ASYNCH_IO
-------------------------------------------------- ---------
/opt/oracle/oradata/AAOP74/datafile/o1_mf_system_j ASYNC_ON
zml41fy_.dbf

/opt/oracle/oradata/AAOP74/itblspc01.dbf           ASYNC_ON
/opt/oracle/oradata/AAOP74/datafile/o1_mf_sysaux_j ASYNC_ON
zml5rwh_.dbf

/opt/oracle/oradata/AAOP74/datafile/o1_mf_undotbs1 ASYNC_ON
_jzml6l1k_.dbf

/opt/oracle/oradata/AAOP74/dtblspc01.dbf           ASYNC_ON

NAME                                               ASYNCH_IO
-------------------------------------------------- ---------
/opt/oracle/oradata/AAOP74/datafile/o1_mf_users_jz ASYNC_ON
ml6m5f_.dbf

/opt/oracle/oradata/AAOP74/btblspc.dbf             ASYNC_ON
/opt/oracle/oradata/AAOP74/cm.dbf                  ASYNC_ON
/opt/oracle/oradata/AAOP74/cm.idx                  ASYNC_ON
/opt/oracle/oradata/AAOP74/bodtblspc.dbf           ASYNC_ON
/opt/oracle/oradata/AAOP74/boitblspc.dbf           ASYNC_ON
/opt/oracle/oradata/AAOP74/DTBLSPC03.dbf           ASYNC_ON
/opt/oracle/oradata/AAOP74/ITBLSPC03.idx           ASYNC_ON
/opt/oracle/product/19c/dbhome_1/dbs/reportdt.dat  ASYNC_ON

14 rows selected.
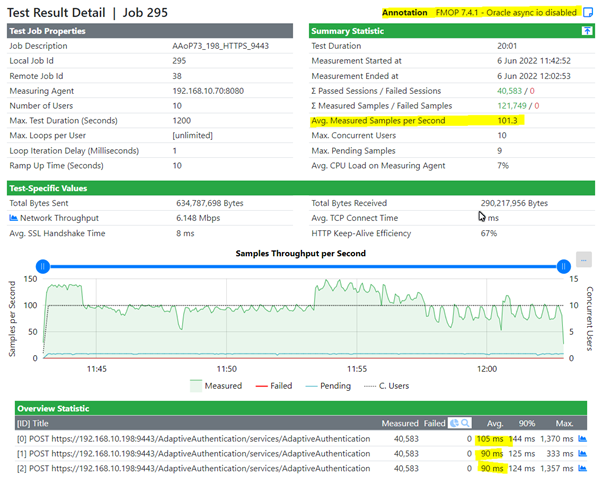
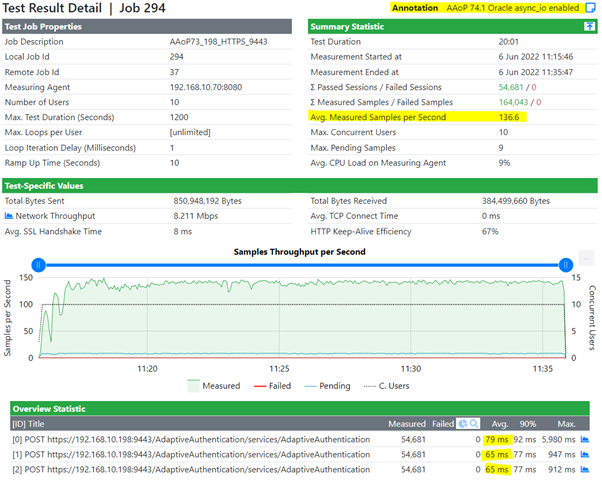
Time to re-run the load test with my preferred tool and the results look encouraging.
As you can see the green results line is much more stable. Not only that, but number of transactions per second (TPS) increased to approx. 136 from 101 in the previous run. Response times also went down somewhat, from 90 to 70ish msecs.
The CPU waitio stats also dramatically improved on the Oracle server:
To summarize, it makes sense to scratch beyond the surface of performance bottlenecks before investing in HW upgrades or so… Sometimes the solution is a low-hanging fruit waiting to be picked.
For various reasons, I’ve had to perform a series of tests to ensure our Measuring Agent can generate traffic from a large number of source IP addresses. Aside from validating that capability, the by-result of the test is a somewhat interesting comparison of a FreeBSD and Linux based Apache HTTPD server.
First, a quick overview of what I wanted to prove: I needed to make sure that we can run a Load Test simulating a large number of source IP addresses. To validate this requirement, I’ve configured one of our Measuring Agents with approx. 12k IP addresses. I’ve used a bash script to do that, as otherwise it would take forever. All IPs are assigned as aliases to the NIC from where the load will be generated, and all IPs are within the same /16 subnet.
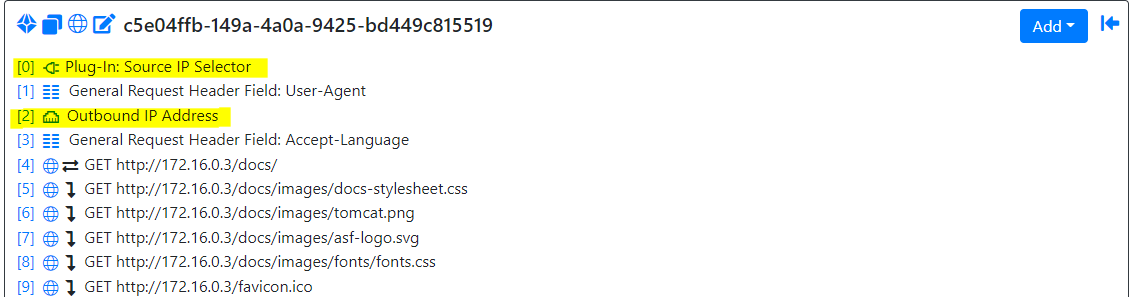
Finally, I’ve configured my Real Load test script with two additional steps:
The hypervisor is a Windows 2019 Server Standard edition machine, running Hyper-V and fitted with an somewhat old Xeon E5-2683v3 CPU. The measuring agent and the tested servers are connected to the same virtual switch.
The Linux and FreeBSD VMs are minimal instals of their distributions, onto which I’ve installed the latest Apache HTTPD build offered by the built in software distribution mechanisms. That’s why the HTTPD versions are not identical.
In order for the results to be somewhat comparable, I’ve deployed the same set of static HTML pages on both servers. I’ve also aligned several key HTTPD config parameters on both systems, as shown in this table.
| Parameter | Measuring Agent | FreeBSD HTTPD VM | Linux HTTPD VM |
|---|---|---|---|
| OS Version | RH 8.4 | 13.0 | Oracle Lnx 8.4 |
| RAM | 4 GBs | 4 GBs | 4 GBs |
| vCPUs | 10 | 4 | 4 |
| HTTPD Version | n/a | 2.4.53 | 2.4.37 |
| HTTPD MPM | n/a | event | event |
| ServerLimit | n/a | 8192 | 8192 |
| MaxRequestWorkers | n/a | 2048 | 2048 |
| ThreadsPerChild | n/a | 25 | 25 |
See further down for other tuning parameters applied to the HTTPD VMs.
I’ve then executed a 20 minutes 1000 VUs load test which, which is configured to maximize the number of HTTP requests generated. Apache is configured to server some static HTML pages, made up of text and some images.
This table summarizes metrics observed once the max. load was reached, approx. 10 minutes into the test. The PDF reports allow you to have a better glance into the test results.
| Metric | Linux HTTPD | FreeBSD HTTPD |
|---|---|---|
| User CPU usage | 21% | 20% |
| System CPU usage | 47 % | 70% |
| Avg reqs/s | 8.8k | 10.3k |
| Avg network throughput | 1.1 Gbps | 1.3 Gbps |
| Hyper-V CPU usage | 10% | 11% |
| Test report PDF | Linux Report PDF | FreeBSD Report PDF |
| Test progress screenshot | 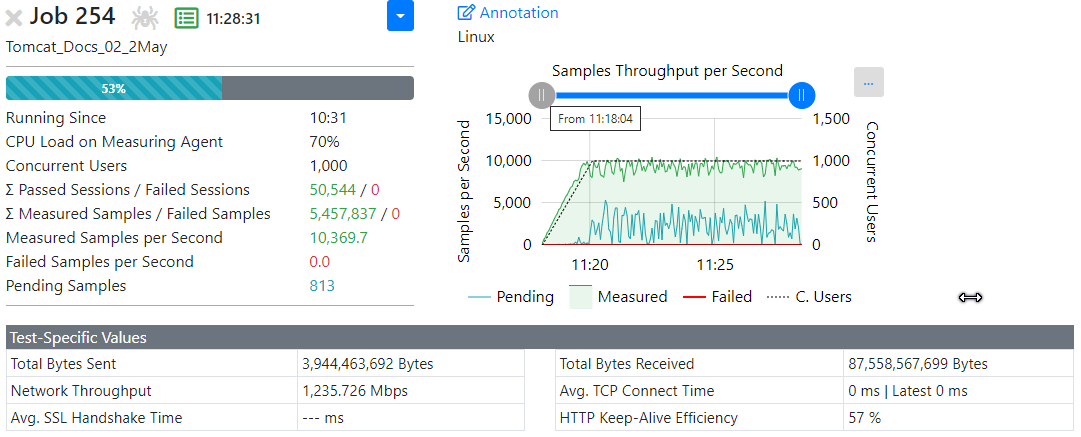 |
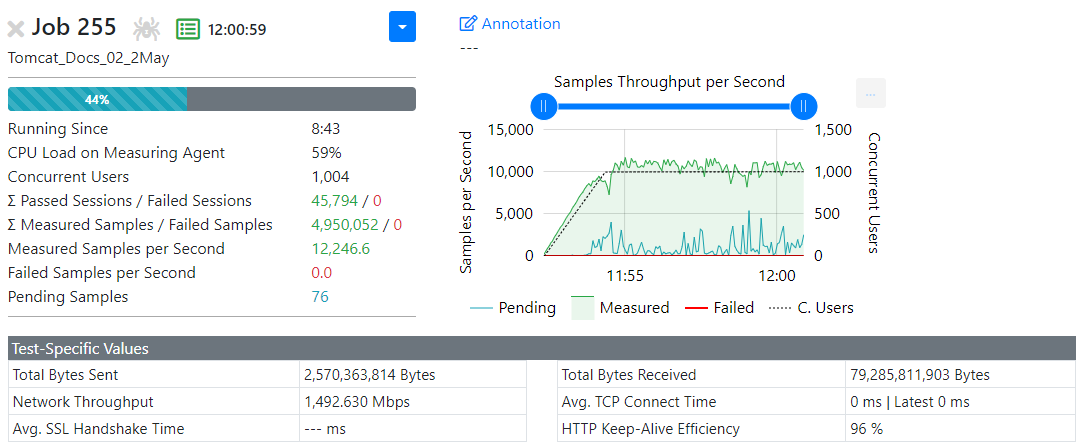 |
… is difficult to pick, to be honest.
Assuming I had time to spend to better tune and align the two platforms, I might have been able to squeeze out a bit more performance from each server, but I doubt that would have materially changed the result in favor of one OS or the other. Obviously I’m happy to be proven wrong…
Feel free to email us with your feedback, I’ll be more than happy to test any further tuning suggestions.
Below the OS level tuning that was applied to the Linux and FreeBSD servers. I didn’t have time to research in full each of the parameters mentioned below, they were mentioned in various other online sources and adopted. I’ve implemented the ones that seemed to make most sense…
The last 2 tunables were required to prevent the Linux server stopping accepting connections for various reasons…
fs.file-max = 524288
net.ipv4.tcp_max_syn_backlog = 2048
net.ipv4.tcp_synack_retries = 3
net.ipv4.tcp_max_orphans = 65536
net.ipv4.tcp_fin_timeout = 30
net.ipv4.ip_local_port_range = 16384 60999
net.core.somaxconn = 256
net.core.rmem_max = 1048576
net.core.wmem_max = 1048576
net.core.message_cost=0
net.ipv4.neigh.default.gc_thresh3=64000
kern.threads.max_threads_per_proc=4096
kern.ipc.somaxconn=4096
kern.ipc.maxsockets=204800
kern.ipc.nmbclusters=262144
kern.maxfiles=204800
kern.maxfilesperproc=200000
kern.maxvnodes=200000
net.inet.tcp.delayed_ack=0
net.inet.tcp.msl=5000
net.inet.tcp.maxtcptw=200000
net.inet.ip.intr_queue_maxlen=4096
net.inet.ip.dummynet.io_fast=1
The Real Load Portal portal.realload.com is open for publich registration.
Feel free to register for an account and trial our product by following the registration instructions here. You’ll be given a two weeks 100 VUs demo license and no credit card is required to sign up!
If you’d like a one-on-one session to guide you through the first steps of how to use our product, please do no hesitate to contact us at sales@realload.com .
Happy testing!
The Desktop Companion is a Desktop GUI that allows you to manage several Real Load aspects directly from your desktop.
We’ve released the latest update and this 5 minutes video illustrates the key changes.
Happy watching!
Today I’ve started executing a lengthy performance test against a SOAP API to seed the underlying DB. For various reasons, I need to replicate the daily DB volume increase of a production system in my own lab DB.
I’ve prepared a Real Load test script and started hammering a server in my lab environment. I’ve noticed the performance wasn’t particularly good but that didn’t matter, as I wasn’t actually executing a performance test.
I’ve let the test run and went for lunch (… a sandwich). When I came back, I’ve noticed that my system became somehow much faster, raising from approx. 50 TPS to approx. 200 TPS. Each transaction represents a SOAP request…
See this graph from the real time monitoring window:
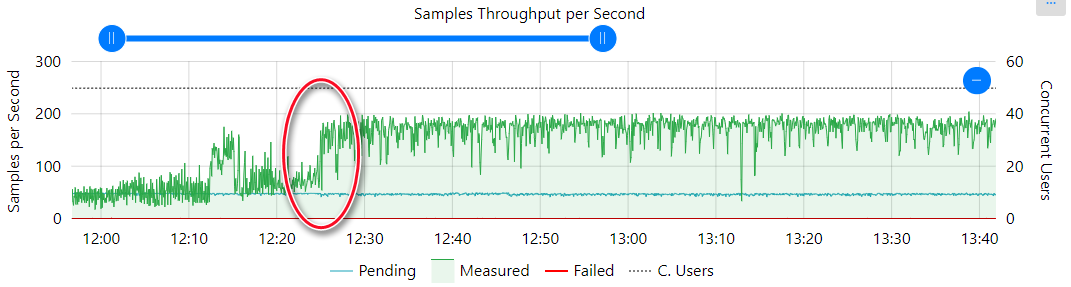
Knowing how this particular product works and knowing that typically the performance is limited by the performance of the underlying DB, I’ve started looking at various DB counters and one thing I’ve noticed is that the Response Time reported by MS SQL Studio on a particular DB file went down considerably (… from 100ms+ to 10-20ms).
That was curios…. why would this happen? I’ve then cast an eye on the metrics of my storage system (a TrueNAS self build…) and noticed that the ZFS L2 ARC read cache hits improved noticeably around that time. Notice the orange line, next to 0% hit ratio around 12PM and then raising to 90%+ after approx. 50 minutes.
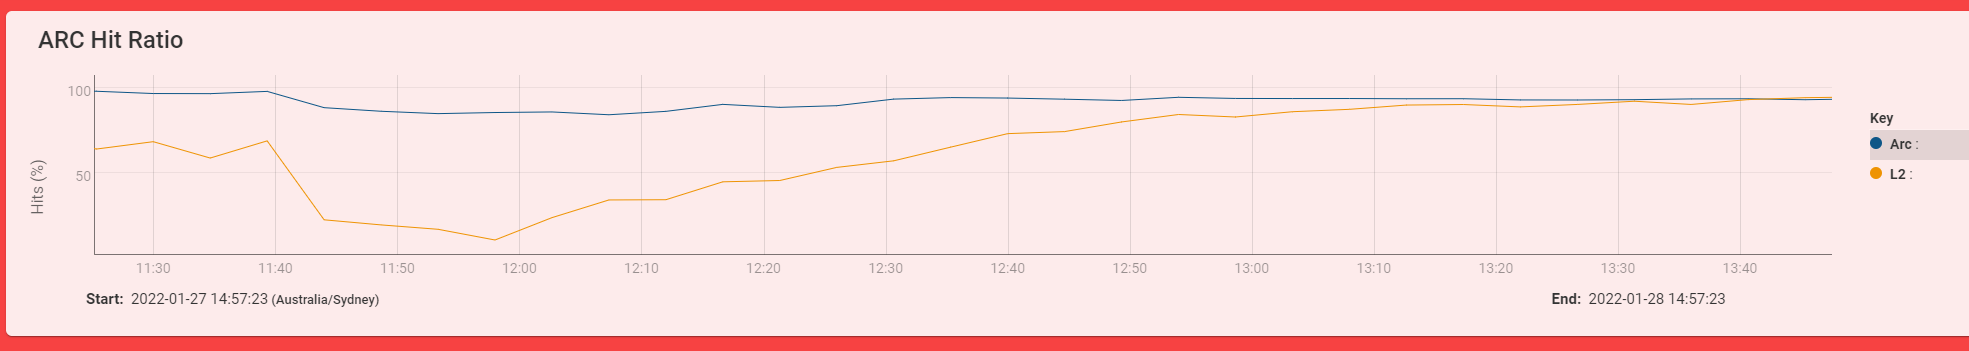
Anyways… this just goes to show that having access to metrics of all infrastructure components during a load test is critical. But sometimes getting to these metrics can really be hard. Just need to persist to get to be bottom of things…..
This is a short update video to illustrate enhancements in the last update of the Desktop Companion.
Enhancements were done to the Proxy Recorder tab:
All of the above is illustrated in this short video…
The Desktop Companion is a Desktop GUI that allows you to manage several Real Load aspects directly from your desktop.
It was freshly released in the last few days, plz do not hesitate to try it out. We’ve put together a short video that shows how to:
All of this in 8 minutes…
It’s the first video I’ve ever had to publish, so I apologize in advance for the rather basic editing…
A great new feature of the Real Load portal is that is allows you to share or simply consume plugins that have been prepared by others.
Plugins are written in Java. There are 3 types of plugin that are supported by the Real Load application:
One of the key fetures of the product is that plugins can be optionally be published on the Real Load portal, for other users to consume. You can have a glimpse of available plugins here.
Interested in plugins but don’t know where to start? We’ll soon publish a getting started documentation on our website. In the meantime please reach out to us at support@realload.com
The demo portal demo2.realload.com is now available for selected customers who wish to evaluate the product functionality. You need an invitation code from us to sign up at the portal.
Quick Start Guide
Note: The Measuring Agent agent2.realload.com has the following restrictions:


