My system just got faster!
Today I’ve started executing a lengthy performance test against a SOAP API to seed the underlying DB. For various reasons, I need to replicate the daily DB volume increase of a production system in my own lab DB.
I’ve prepared a Real Load test script and started hammering a server in my lab environment. I’ve noticed the performance wasn’t particularly good but that didn’t matter, as I wasn’t actually executing a performance test.
I’ve let the test run and went for lunch (… a sandwich). When I came back, I’ve noticed that my system became somehow much faster, raising from approx. 50 TPS to approx. 200 TPS. Each transaction represents a SOAP request…
See this graph from the real time monitoring window:
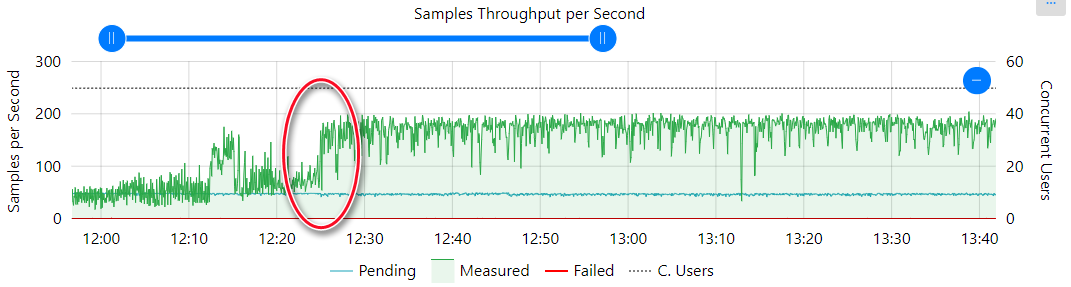
Knowing how this particular product works and knowing that typically the performance is limited by the performance of the underlying DB, I’ve started looking at various DB counters and one thing I’ve noticed is that the Response Time reported by MS SQL Studio on a particular DB file went down considerably (… from 100ms+ to 10-20ms).
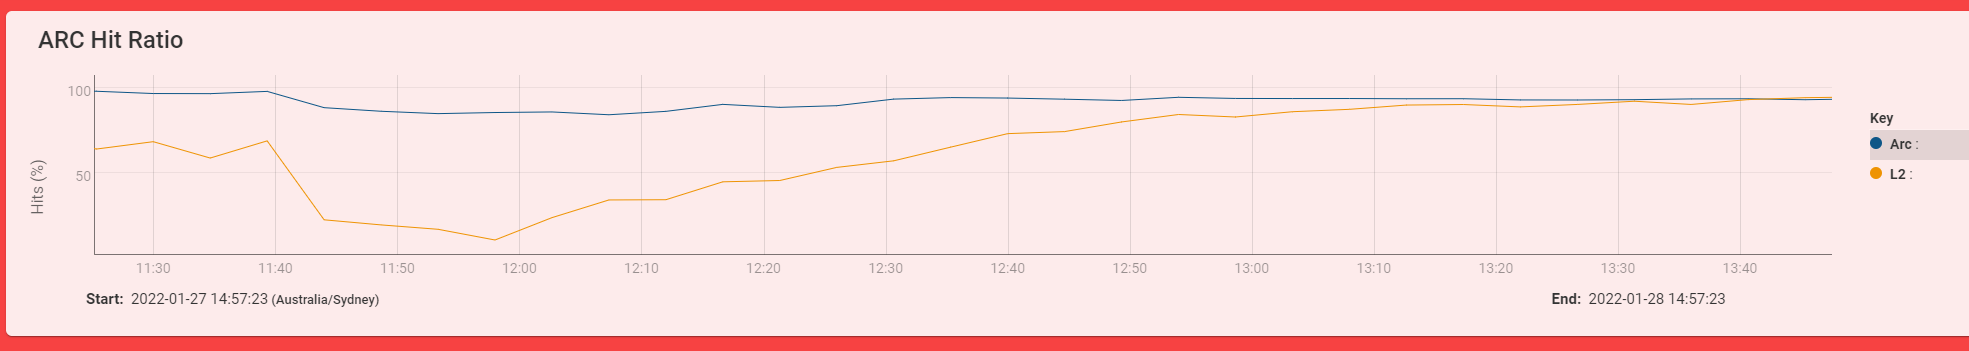
That was curios…. why would this happen? I’ve then cast an eye on the metrics of my storage system (a TrueNAS self build…) and noticed that the ZFS L2 ARC read cache hits improved noticeably around that time. Notice the orange line, next to 0% hit ratio around 12PM and then raising to 90%+ after approx. 50 minutes.
Anyways… this just goes to show that having access to metrics of all infrastructure components during a load test is critical. But sometimes getting to these metrics can really be hard. Just need to persist to get to be bottom of things…..